Sunday, January 23, 2022

Ichimoku Cloud System—Knowing the Basics

Figure 1.  A chart of $SPXEW (on 12/02/2021) with the Ichimoku trading strategy


Ichimoku Cloud System


Ichimoku Cloud is a set of indicators designed as a standalone trading system. These indicators can be used to identify support and resistance, determine trend direction and generate trading signals. Ichimoku Kinko Hyo, the Japanese name for the technique, is translated as “one look equilibrium chart (一目均衡圖).” With one look, chartists can identify the trend and look for potential signals within that trend.

For example, @Mayhem4Markets has used Ichimoku Cloud (see Figure 1) to analyze the trend of $SPXEW (S&P 500 equal weight) as follows: 
$SPXEW back in to the cloud here, neutralizing a near term downtrend potentially. Watch overhead resistance. I like using $SPXEW sometimes since it shows more about breadth (or the lack thereof) in its price action.
In the opinion of @ndshah26, he also think high of Ichimoku Cloud System:
Glad to see some other people using the Ichimoku cloud system…Its a real good indicator and works pretty well with MACD and ADX (see Figure 2)…Just in case you haven’t tried it already?
Figure 2.  A chart of $NDX (on 01/21/2022) with Ichimoku Cloud, MACD and ADX


Basic Lines of the Ichimoku Cloud


There are five lines on the Ichimoku Cloud chart at any given time (see Figure 2):[1]
  1. Tenkan-sen (Conversion Line or 轉換線)
    • On a daily chart, this line is the midpoint of the 9-day high-low range, which is almost two weeks.
    • The Conversion Line (blue) is a relatively short-term indicator designed to catch turns early. Catching the turn early will improve the risk-reward ratio for trades. 
  2. Kijun-sen (Base Line or 基線)
    • On a daily chart, this line (red) is the midpoint of the 26-day high-low range, which is almost one month.
  3. Senkou Span A (Leading Span A or 先行帶A)
    • This is the midpoint between the Conversion Line and the Base Line. 
    • The Leading Span A forms one of the two Cloud boundaries. It is referred to as “Leading” because it is plotted 26 periods in the future and forms the faster Cloud boundary.
  4. Senkou Span B (Leading Span B or 先行帶B)
    • On the daily chart, this line is the midpoint of the 52-day high-low range, which is a little less than 3 months. The default calculation setting is 52 periods, but it can be adjusted. 
    • This value is plotted 26 periods in the future and forms the slower Cloud boundary.
  5. Chikou Span (Lagging Span or 遲行帶)
    • This line (green) is created by plotting closing prices 26 periods behind the latest closing price of an asset.
Video 1.  Trading strategies discussed using the latest stock market (YouTube link)

Trading Strategies


Watch Video 1 for the demonstration of using Ichimoku Cloud strategy in the latest stock market (as of 01/23/2022).  But, the basic principles can be summarized as the below:[1]

Bullish Signal

Chartists use the actual cloud to identify the overall trend and establish a trading bias. Once said bias is established, chartists will wait for a correction when prices cross the Base Line (red). An actual signal triggers when prices cross the Conversion Line (blue) to signal an end to the correction.

This trading strategy will set three criteria for a bullish signal:
  1. Price is above the lowest line of the cloud (bullish bias)
    • In other words, prices are either above the cloud or remain above cloud support
  2. Price moves below the Base Line (pullback)
    • It improves the risk-reward ratio for new long positions
  3. Price Moves above the Conversion Line (upturn)
    • A bullish signal triggers when prices reverse and move above the Conversion Line (blue).
As you can see, the three criteria will not be met in just one day. There is a pecking order to the process: 
First, the trend is bullish as defined by the cloud. Second, the stock pulls back with a move below the Base Line. Third, the stock turns back up with a move above the Conversion Line.
Bearish Signal 

This trading strategy will also set three criteria for a bearish signal:
  1. Price is below the highest line of the cloud (bearish bias)
    • This means price is either below the cloud or has yet to break above cloud resistance. 
  2. Price moves above the Base Line (bounce)
    • This signals a bounce within a bigger downtrend
  3. Price moves below the Conversion Line (downturn)
    • A bearish signal triggers when prices reverse and move below the Conversion Line.
Monday, January 17, 2022

Index Liquidity versus Volatility Level

Market liquidity refers to the depth of buy and sell orders. A liquid market is one where you can buy or sell quickly. Volatility refers to a market's rate of change. A volatile market is one in which price changes rapidly over a short period of time.  Basically, the relationship between liquidity and volatility can be summarized as:
  • Volatility is related to several factors, and liquidity is only one of them
    • In the context of volatility, it means that there are always plenty of buyers and sellers whenever someone wants to buy or sell.
  • Liquidity keeps the bid-ask spread small. Liquidity by itself may not reduce the volatility of a stock, but a lack of liquidity can definitely cause wild volatility.

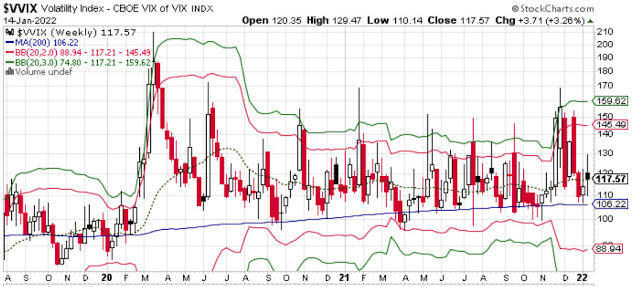
Figure 1.  CBOE VIX of VIX Index (Source: stockchart.com)

Volatility and the Amount of Consensus on Market Valuations


In [3], Steve Sosnick wrote that the amount of volatility is inversely proportional to the amount of consensus about market valuations
If there were a perfect consensus on the valuation of a given item, then its price wouldn’t move. Conversely, if there were wildly divergent views about that item’s value, then its price would vary substantially. We certainly lack consensus about how to value the situation in Ukraine, and thus we have seen market volatility accompanying it.

Liquidity Can Affect Volatility


Multiple waves of uncertainty have swept over Wall Street in the past month (i.e., 2021 December): concerns about rising wages and inflation, the Omicron variant becoming widespread, and especially Federal Reserve turning more hawkish:[1]
Do not underestimate the effects of liquidity withdrawal. The mammoth balance sheet the Fed has built up was a key determinant of liquidity across markets. As balance sheet runoff is put into motion, the withdrawal of liquidity will have profound impacts. Determining how it plays out is far from straightforward and will be determined by a variety of factors. Understanding the details matters. So hold on tight – there’s volatility ahead.
These increasing waves of uncertainty drive rising implied volatility (VIX). The above chart shows the 200-week moving average of VVIX (Volatility of VIX) has slowly moved upward since the March 2020 correction[2]
Note how the Bollinger Bands  for 2 and 3 standard deviations (red and green) have dramatically expanded in the last few weeks. We expect with all the uncertainty heading into 2022 that high volatility will be the new normal for markets.

Volatility Rise Also Triggers Futures Liquidity Crunch


Analysts have penned many posts about how the Federal Reserve tapering of bond purchases and possible interest rate hikes in 2022 will cause a liquidity crunch for investors. 

Another faster-moving factor is adding to the liquidity crunch. That factor is liquidity falling in futures and derivatives markets when volatility rises. The following graph from Goldman Sachs shows how futures liquidity falls as the VIX rises:[2]
When liquidity falls, the decline in prices accelerates due to fewer buyers. Futures and options volumes are now greater than volumes in the underlying stocks. Thus, derivatives have an increasing influence on market prices and movement

Figure 2.  Sources: Goldman Sachs, Bloomberg, The Daily Shot – 11/30/21

Sunday, January 16, 2022

Technical Analysis—Two Indexes Highly Correlated to $SPX

Figure 1.  US Finanaical Asset Managers & Rydex Bull/Bear Asset Ratio
(Source: @SuburbanDrone)


Rydex Bull/Bear Asset Ratio

!RYRATMM is 

  • Rydex Asset Ratio - Bear + MM Assets/Bull Assets (NBD)

$ONE:!RYRATMM is the inverse of  !RYRATMM (or 1 / !RYRATMM) , which represents:

  • Rydex Bull/Bear Asset Ratio
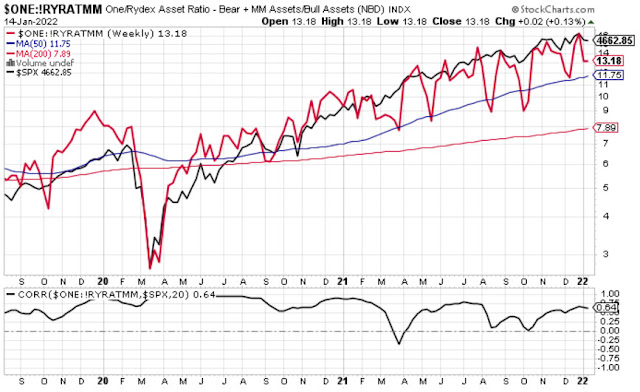
As show in Figure2, 1/!RYRATMM (red) and $SPX (black) have high positive correlation.

Figure 2.  Relation between 1/!RYRATMM (red) and $SPX (black; Source: stockchart.com)


US Financial Asset Managers


Asset management stocks (e.g., STT, TROW, JEF), once the bellwethers of Wall Street, fell out of favor spectacularly in 2018, with the Dow Jones U.S. Asset Managers Index ($DJUSAG) slumping 27% for the year, underperforming the S&P 500 by roughly 20%. The industry had margins squeezed from lower fees, a continuing shift toward passive products, capital expenditure on technology and increased compliance costs. To add further pain, a plethora of managers failed to beat the market, which resulted in many investors requesting redemptions.

As show in Figure 3, $DJUSAG (red) and $SPX (black) have high positive correlation.

Figure 3.  Relation between 1$DJUSAG (red) and $SPX (black; Source: stockchart.com)


Figure 4.  Margin Debt (Source: @MFHoz)


Saturday, January 15, 2022

Options Expiration—Knowing the Basics

There is an $SPX options expiration every Mon, Wed and Fri, and traditional monthly options expire every 3rd Friday of the month.  For example, this past Friday (08/19/2022)  is an option expiration week.  And here is what The Market Ear commented after this option expiration day:
We had a relatively big "gamma roll off" post this expiration, the "stabilizer" is gone. Don't forget that we also flip into short gamma should the market move lower. Absolute levels to the downside are not big at the moment, but demand for downside protection could "kick in" again, leading to vol becoming bid, dealers selling deltas to delta hedge and the entire short gamma dynamics play out again.

Option Expiration: A.M. or P.M.


Every option contract has a specific expiration date, and time. The time of expiration can be either in the morning (a.m.) or in the afternoon (p.m.).[1]
Options that expire at the close of the market are considered p.m. and options that expire the morning of the last trading day are a.m.

The vast majority of options on futures expire at the close of the market on the last trading day, but there are notable exceptions. Options with a.m. expiration are generally written on a future contract that has the same expiration date and time. Futures that are financially settled, meaning they settle to cash payments rather than physical commodities, are often settled using a.m. expiration.

Large Expiries


What are "large" expiries?[2]
Longer maturities tend to be listed on a quarterly (Mar/Jun/Sep/Dec) and yearly (Dec) basis only.  For example, currently, only December expiries are listed beyond June 2023.  Since these maturities have been around for longer, they accumulate a considerable open interest.

Quarterly third Friday options also have an added benefit of $SPX futures expiring on the same date

Table 1. Opex Week Performance By Month (Source: [4])


Why Expiration Time Is Important?


S&P 500 options began trading in mid-1983. The table above was compiled by Rob Hanna on year 2015. It goes back to 1984 and shows op-ex week performance broken down by month.  Based on him:[4]
The seasonality of Op-ex weeks varies.  However, it is in general is pretty bullish. March, April, October, and December it has been especially so.  The seasonality of these weeks varies, with March being one of the strongest OpX weeks of the year.
Furthermore, $SPX options make up 16% of the $SPX market cap in year 2021.  As Sergei Perfiliev pointed out that:
Options gamma is one of the most significant structural flows within the equity markets. Delta-hedging and unwinding these positions can increase market activity around the expiration time.
To learn more about options gamma and delta-hedging, read [2] for more details.

Video 1.  How to analyse Open interest (YouTube link)

References

  1. Understanding AM/PM Expirations
  2. Understanding the options gamma (Sergei Perfiliev; YouTube link)
  3. The Fat Pitch (03/12/2016)
  4. Opex Week Performance By Month, And Why March Opex Is Notable
  5. Select Sector Index Futures (CME Group)