Sunday, July 17, 2022

Investment—Finding A Market Bottom

Finding a market bottom is not as straightforward as you might hope, it's a complicated process.  For example, Thomas Lott—a former hedge fund portfolio manager—said that he uses multiple approaches:
We analyze yield curves, technical data, prior bear markets and corporate earnings among other metrics looking for signs of a bottom.

In this article, we will list some ways to identify a potential market bottom and start with Marko Kolanovic's playbook first.


Marko Kolanovic


Based on JPMorgan's Marko Kolanovic, if you believe stock market will transform into something bigger than just a bounce, then consider the following plays according to the investment bank:

  1.  Longs in small-caps (P/E ratio is below Lehman bankruptcy and peak COVID)
  2.  Longs in Biotechs (~1/3 of the companies trade below cash)
  3.  Long China (reopening and stimulus are powerful tailwinds), including Tech/Internet
  4.  Long Cyclicals vs. Short Defensives
  5.  High Beta Growth, including ARKK ETF. Many of these names have lost as much as similarly viewed names in the Tech Bubble.

IWM / XBI / FXI


In the below figure, we have listed the current prices of IWM (i.e., small caps), XBI (i.e., bio techs), and FXI (i.e., China) in the same diagram.

Figure 1.  Small caps / Biotechs / China (courtesy: stockcharts.com)

Cyclicals vs Defensives


Cyclical stocks include discretionary companies, such as Starbucks or Nike, while defensive stocks are staples, such as Campbell Soup. Cyclical stocks usually have higher volatility and are expected to produce higher returns during periods of economic strength.

So, we can use XLY (i.e., discretionary stocks) and XLP (i.e., defensive stocks) ratio to measure the strength of cyclical stocks' relative to defensive stocks'.

Figure 2.  XLY / XLP (courtesy: stockcharts.com)


High Beta Growth vs. Cash


As Marko Kolanovic said, high beta growth (e.g., ARKK) should perform better if a market bottom is in.  For example, we may measure the relative strength between ARKK and COWZ.
Note that COWZ is a strategy driven exchange traded fund that aims to provide capital appreciation over time by screening the Russell 1000 for the top 100 companies based on free cash flow yield.

Figure 3.  ARKK / COWZ (courtesy: stockcharts.com)

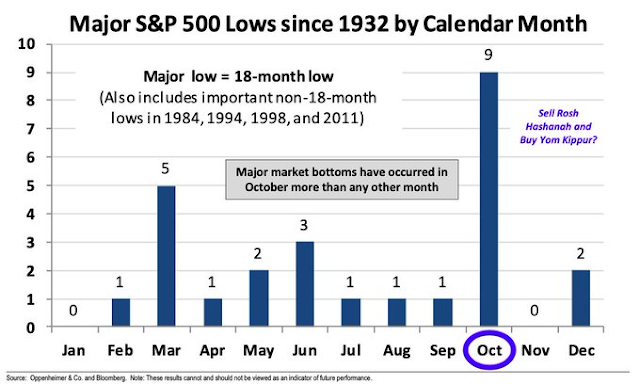
Major S&P 500 Low by Calendar Month


Finally, as @AriWald shared on Twitter:
"Major market bottoms have occurred in October more than any other month" 

Figure 4.  Major S&P 500 Lows since 1932 by calendar month

Friday, July 8, 2022

Investment—Market Topping Process

Figure 1. 2021 - 2022: Bonds ($AGG) Stock ($SPY) → Commodities ($DBC) 

Market Topping


Market topping is a process which normally includes different asset classes peaking in a specific sequence.  Using tech bubble as an example:
  1. Bond market peaked in 1999
  2. Stock market peaked in early 2000
    • Stock market historically peaks an average of seven months before every recession
  3. Commodity market peaked in fall 2000

bear market is normally triggered by the following series of events:
  1. Inflation rises
  2. Interest rate rises
  3. Oil price rises
  4. Fed hikes rate
Note that official recession calls are the responsibility of the NBER Business Cycle Dating Committee.  Since WWII, every recession is preceded by either an oil shock or a Fed's tightening its monetary policy.

Saturday, July 2, 2022

Move Index—Bond Market Volatility

Many of us are familiar with the VIX Index, commonly referred to as the “Fear Index”. 
The VIX Index is a measure of “fear” as that relates to equity markets and typically rises during periods of falling prices, sometimes sharply during more precipitous declines.
 

Move Index


Did you know that there is a similar index that measures fear within the bond market? That index was developed by Merrill Lynch and is referred to as the MOVE Index.[2]
The index rises as concerns grow that interest rates are on the march higher. The index will rise more sharply when there are fears in the market that rates may be headed significantly higher as was the case during the 2013 Taper Tantrum.

As shown in Figure 1, the current Move index is at a very high level, which has already surpassed Corona panic highs. 

Figure 1.  MOVE Index (07/02/2006 - 07/02/2022)

Time to Invest in Bonds?


When interest rates are marching higher, is it a time to invest in bonds? Based on Tatiana Darie, her answer is:

Investing in bonds hasn't always been the winning strategy even as yields surge on central bank tightening. Only if you think we're headed for a downturn soon.


References

  1.  VIX (Wikipedia)
  2. The Move Index