Monday, May 30, 2022

Investment―Stagflation 2.0

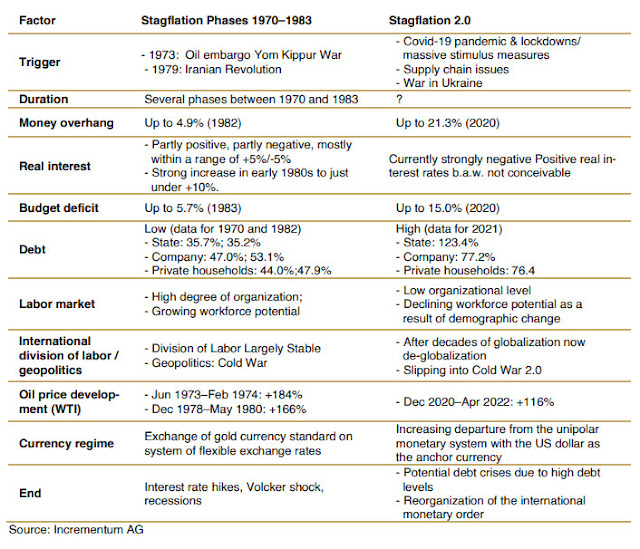
Table 1. Stagflation 1.0 (1970-1983) vs 2.0

Stagflation, or recession-inflation, is an economic phenomenon marked by persistent high inflation, high unemployment, and stagnant demand in a country's economy.[1]
During a particularly severe period of economic conditions in the 1970s, rising inflation and slumping employment put a damper on economic growth in the United Kingdom and seven other major market economies, and investors in equity markets suffered greatly as a result.
Historically, the last pronounced stagflation phases occurred between 1970 and 1983. These were made possible by a liquidity overhang, which had its origins in an excessively loose monetary policy, and were triggered by oil shocks caused by geopolitical tensions.[2]

Stagflation 2.0


In its "In Gold We Trust" report, incrementum (i.e., a fund and asset management firm) believes we're in another period of stagflation and minted the term "stagflation 2.0".  

We will certainly not have to endure a repeat of the stagflation of the 1970s; rather, we’ll see stagflation 2.0, with its numerous peculiarities.

In table 1, you can view its comparison between Stagflation (1970-1983) and Stagflation 2.0.  You can also read [2] for more details.


References

  1. How to Protect Your Finances From Stagflation
  2. Stagflation 2.0 (pdf)

Investment—Accounting Gimmicks Used by Execs to Cook their Books

In 2016 volatile stock market, Bert Dohmen has warned the casual investors that:[1]
At the start of a bear market a casual investor, who is easily swayed by the opinions of others, should not listen to the opinion of any analyst with a conflict of interest. They are either with Wall Street or have investment management jobs. Both have big conflicts. None of those people can ever be candid about their opinions of the markets 
If you want analysis and forecasts without conflicts of interest, find someone with lots of experience who doesn’t work for Wall Street, who doesn’t manage money or sell investments. You never want to guess if what you hear or read is tainted.


Accounting Gimmicks


Stocks move on earnings, so execs will manipulate earnings. How can you spot their accounting gimmicks ahead of time? 

In her twitter thread, @FabiusMercurius has shared her thoughts. Here’s a rundown of top shenanigans execs used to cook their books:

1. Using SPVs to hide bad debts case: 


Enron created multiple Special Purpose Vehicles (SPVs), then gave them $ENRN stock while the SPVs gave back case. The SPVs then used Enron stock to hedge assets on Enron's balance sheet.  Enron got to reduce write-offs & report “improved” debt-to-equity. 

2. Reporting bogus revenue case: 


In 2008 Lehman Bros “sold” $50B of πŸ’© garbage loans to Cayman Island banks under the promise to buy them back after the fiscal/quarter ends.  This created the impression to wall street that Lehman had $50B more cash than it actually did. 

3. Round-tripping (when 2 companies buy/sell repeatedly to inflate sales) 


Case i: Valeant sold Philidor (which it had the option to buy) inflated shipments of a toenail fungus drug
Case ii: Dynegy's energy trading biz pre-arranging many buy-sells w/ an ally at designated price 

4. Recording revenues too soon 


GAAP says revenue is recognized when a goods/service is delivered, not on cash payment/upfront. 
Case: Xerox "accelerated" $3B in service fees, boosting EBIT by $1.5B.  Top execs rewarded themselves $35M in RSUs for hitting earnings targets. 

5. “Mucking” 


With depreciation to understate expenses case: literal muck-handler πŸ’©πŸ’©Waste Management Inc. avoided depreciation expenses by inflating salvage value & extending the useful lives of its garbage trucks. 

6. Recording expenses too late 


GAAP says expenses are recognized when incurred, not when paid in cash. case: Nut-seller Diamond wanted to acquire Pringles from P&G with stock. DMND had to boost its share price. Screws walnut growers by delaying payments to offset other FY'11 costs. 

7. Booking opex as capex case: 


WorldCom used its cash flows statement to hide expenses by marking operating costs, which should have been opex, as capex. WorldCom inflated cash flow by $3.8 billion and posted quarters of positive performance when it really lost money. 

8. Channel stuffing 


When a company ships customers excess goods that were not ordered to temporarily inflate accounts receivable.  Case: Krispy Kreme allegedly sent franchises 2x usual shipments at the end of financial quarters so the company could meet Wall Street forecasts 

9. Boosting income with 1-time gains 


This one not illegal. case: At quarter ends, Lehman Bros sometimes used “repo 105” an accounting trick that defines a short term loan as a sale. Cash from sales gave the appearance of lowered reported liabilities. 

10. "Big baths" 


Also not illegal. When a new exec steps in, s/he may write off all losses possible to blame previous management. This makes the company look worse than it is, giving the new exec a low starting bar on which to build future cred 

11. Hiding losses in acquisitions: 


I-bankers charge stupidly high fees… how can CEOs use that to their advantage? 
πŸ€”"those πŸ‘ πŸ‘œ for my wife last quarter… advisory expense!" 
 ex: Tech giant Olympus hid losses on securities investments for years under the cover of acquisitions. 

12. Cookie jar reserves 


When execs hide income in order to report them in a future quarter when performance needs a boost case: 
Pre-2002 Dell hid undisclosed payments from Intel... between 2002-2006 it dipped into the jar every quarter to cover shortfalls in operating results.

References

  1. Why The Next Two Years Could Be Worse Than 2008
    • Before the end of March, hedge funds will probably be hit with big redemptions because of poor performance. Junk bonds will take the worst hit. Debt defaults on banks loans or ‘rescheduling,’ will cause concerns about the banking system.
  2. What is EBITDA?

Investment—Trading Jargon 101

The below information was shared by @FabiusMercurius on her twitter thread:


Trading Jargon 101


1. Market maker vs Market taker 


Markets are made up of makers & takers. Makers: "producers" of buy/sell orders (they create quotes based on the max price at which they'd buy & min at which they'd sell) Takers: "consumers" (they buy or sell instantly at the maker's price quote)

2. Passive vs Aggressive Order (Limit vs Market Order) 


Passive/limit order: a trader sets a new price, different from the going rate (e.g. buy $TSLA at $800, while current price is $616) Aggressive/market order: a taker executes a buy/sell immediately @ whatever the going rate

3. Liquidity


People often describe market makers as "liquidity providers." Liquidity is the degree to which one can quickly buy/sell a security. In markets with lots of quotes flying around, orders get matched & filled fast (high liquidity). Makers add liquidity; takers remove.

4. Bid-Ask (Bid-Offer) 


The 2-part price quote that market makers put out for each tradable security. Bid: highest price the Market Maker is willing to buy at Ask/Offer: lowest price the Market Maker is willing to sell at Bid-ask spreads widen during greater market uncertainty & lower liquidity.

5. "Hit the Bid" & "Lift the Offer"


A trader "hits the bid" when s/he agrees to sell at the market maker's bid price. A trader "lifts the offer" when s/he agrees to buy at the MM's offer price. In both cases, the trader is a market taker, i.e. placing an aggressive order.

6. "Cross the spread"


When a trader "crosses the spread" this means the exact same thing as placing an "aggressive order", aka acting as a "market taker" by either hitting the bid or lifting the offer. I think you get the trend now... traders have 99 ways to express 1 concept.

7. "Fill or kill" 


An order to buy/sell that must be executed immediately & entirely; otherwise the whole order gets cancelled. No partial execution allowed, which can arise if there's low liquidity (e.g. buyer wants 10k shares of $AUVI @ 10.50 but only 8.5k available to sell)

8. Open vs. Close (options) 


When trading options - Buy/sell to open: buy/sell a call or put to initiate a long or short position, i.e. take on directional risk - Buy/sell to close: buy/sell a call or put to close out of a position, i.e. bring net directional risk back to zero

9. Margin 


There's a couple nuances in how to use the term "margin." - To "buy on margin" means to buy an asset by borrowing the balance from a bank or broker (e.g. 20% down, 80% financed) - "Margin" itself is the collateral a trader deposits w/ a broker to cover credit risk.

- Brokers may ask traders to "post margin" before initiating a trade, esp. in options. - Such "margin requirements" are specified as minimum %s of total contract value that a trader needs to post to ensure that if the price moves adversely, s/he has enough money to cover losses.

10. Margin calls 


A trader gets "margin called" when some security in the portfolio suddenly super rallies or super crashes (depending if s/he was short vs long) and there's not enough collateral to reflect the new risk. The trader can then either put more money in or unwind.

11. Puke 


Traders "puke" when some position in their portfolio is losing so much value that in order to minimize further losses the trader must unwind. Long traders that puke are forced to sell at a loss; shorts that puke are forced to cover at a loss (e.g. $GME, $AMC scenarios).

12. Short Squeeze 


A special case where short-sellers get margin called, i.e. puke. The squeeze usually begins when short interest is high & buyers start bidding up the stock. Initial shorts panic-buy to cover & push the price up in a vicious cycle that causes more shorts to puke.

13. Basis points, bps, "bips" and "pips" 


They all mean the same thing. 1/100th of a percentage point (0.01%) Bips are used to describe the change in value of securities or the rate change in an index or other benchmark. In forex, traders typically use "pips."

14. Par 


More nuances again (traders really know how to use language to keep outsiders out). If you google par, you'll get something really confusing about face values specified in some charter for stock & bond issuance. Ignore the stock part; no equities trader talks par, ever.

Par is only colloquially used for bonds. It means $1000, i.e. the standard denomination at which all bonds are issued (in the US). Bonds that trade "at par" are still worth $1,000 per contract. Instead of "at par," traders may say "at 100" (aka at 100% of par value).

Order book


15. Order Book 

"How to read an order book" is worth a thread of its own, but for now think of it as an exchange's placard of buy & sell orders. Use case: Order books give traders a sense of demand levels and support & resistance (e.g. buy walls / sell walls, see next posts)

16. Market Depth 


Most order books show two green & red histograms visualizing real-time volume of bids & asks for a security across specified prices, aka the "market depth." The deeper the order book, the more traders can place large block orders w/out moving the price.

Buy wall & sell wall

17. Buy wall & sell wall 

A disproportionately large spike sloping upwards on either side of the market depth chart is called a wall. Buy walls are spikes on the bid (green) side; sell walls are spikes on the ask (red) side. It means there is a large whale putting up a big block.

18. Block trade 


A block trade is basically one giant order to buy or sell -- so big that it's usually executed outside of the public exchanges so as to not move the market (i.e. over the counter via "dark pools" or "block houses" where these transactions stay hidden from public).

19. Dark Pools 


Private trading systems that buy/sell large blocks of securities on behalf of whale clients who wish to preserve anonymity & avoid moving the market. They execute blocks by either finding another whale counterparty or chunking up large orders into smaller batches.

20. Slippage 


Say you execute a market order to buy 100 shares @ $20. You blink & see that it was filled at... $20.33? Very annoying. This is called slippage. What coulda happened under the hood: 67 shares were available at $20; You ate through them; the next 33 were offered at $21.

The darker the color the riskier the financial asset.
The darker the border the less liquid the instrument