Revealing True Purchasing Power: Nominal vs. PPP GDP Per Capita
GDP per Capita
- Luxembourg ($140,941): Leads due to its financial sector, tax haven status, and small population (~660,000).
- Ireland ($108,919): High ranking due to multinational tax strategies, though GNI is preferred locally to adjust for distortions.
- Switzerland ($104,896): Strong finance and innovation sectors.
- Singapore ($92,932): Financial and trade hub with favorable taxes.
- Iceland ($90,284): High living standards, small population.
- Norway ($89,694): Oil wealth and sovereign fund.
- United States ($89,105): Richest large-population country (>10 million), driven by diversified economy.
- Qatar (#10, $71,653): Oil and gas wealth, small population.
- United Arab Emirates (#23, $49,498): Oil-driven economy.
- Saudi Arabia (#43, $30,099): Benefits from oil exports.
- Norway (#6, $89,694): Oil wealth reinvested into $1.4T sovereign fund, stable economy.
- Guyana (#41, $32,326): Rapid rise due to recent offshore oil discoveries.
- Tax Havens Dominate: Luxembourg, Ireland, and Singapore rank high due to low taxes attracting multinationals (e.g., Ireland’s 12.5% corporate tax rate).
- Small Populations: Top countries often have small populations, amplifying per capita metrics.
- Resource Wealth: Oil and gas boost rankings for Qatar, UAE, Norway, and Guyana.
- Large Economies Lower: Germany (#19), Japan (#38), UK (#20), and France (#24) rank lower due to larger populations diluting per capita GDP.
GDP per Capita Calculated at Purchasing Power Parity (PPP)
Beyond Nominal GDP: Why PPP Offers a Clearer Picture of Economic Well-Being
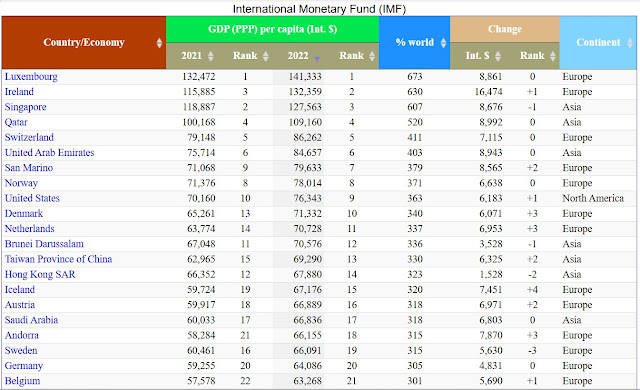
Comparing Belgium and Taiwan’s rankings in nominal GDP per capita (2025) and PPP GDP per capita (2022) highlights the differences between these metrics and their implications for assessing economic wealth:
Belgium
- Nominal GDP per Capita (2025): 16th ($57,772)
- PPP GDP per Capita (2022): 21st (Int. $63,268)
Insight: Belgium ranks higher in nominal terms than in PPP, suggesting its high living costs reduce real purchasing power. Its economy, driven by trade and finance, benefits from a strong nominal GDP, but expensive domestic prices lower its PPP rank.
Taiwan
- Nominal GDP per Capita (2025): 37th ($34,426)
- PPP GDP per Capita (2022): 13th (Int. $69,290)
Insight: Taiwan ranks much higher in PPP than in nominal terms, indicating lower living costs amplify real purchasing power. Its tech-driven economy generates moderate nominal GDP, but affordable domestic prices significantly boost its PPP rank.
Conclusion
PPP is a more accurate indicator of actual living standards, especially for comparing countries with varying price levels, while nominal GDP better reflects global economic influence or unadjusted wealth.
Note: "Int. $" refers to International Dollars, a hypothetical currency used in Purchasing Power Parity (PPP) calculations to compare economic data across countries. It adjusts for differences in price levels and living costs, reflecting the real purchasing power of a country's income relative to a standard basket of goods and services.


Comments
Post a Comment