 |
Figure 1. US Finanaical Asset Managers & Rydex Bull/Bear Asset Ratio
(Source: @SuburbanDrone)
|
Rydex Bull/Bear Asset Ratio
!RYRATMM is
- Rydex Asset Ratio - Bear + MM Assets/Bull Assets (NBD)
$ONE:!RYRATMM is the inverse of !RYRATMM (or 1 / !RYRATMM) , which represents:
- Rydex Bull/Bear Asset Ratio
As show in Figure2, 1/!RYRATMM (red) and $SPX (black) have high positive correlation.
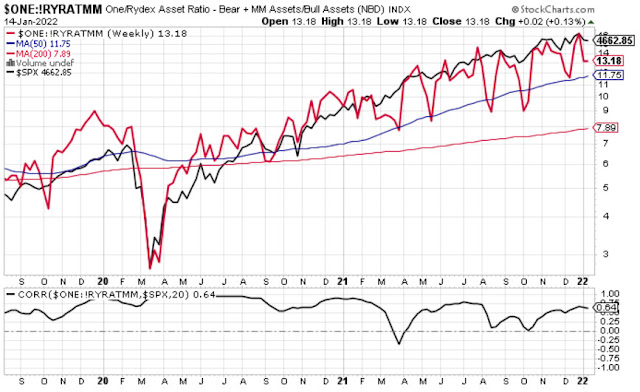 |
| Figure 2. Relation between 1/!RYRATMM (red) and $SPX (black; Source: stockchart.com) |
US Financial Asset Managers
Asset management stocks (e.g.,
STT,
TROW,
JEF), once the bellwethers of Wall Street, fell out of favor spectacularly in 2018, with the Dow Jones U.S. Asset Managers Index (
$DJUSAG) slumping 27% for the year, underperforming the
S&P 500 by roughly 20%. The industry had margins squeezed from lower fees, a continuing shift toward
passive products, capital expenditure on technology and increased compliance costs. To add further pain, a plethora of managers failed to beat the market, which resulted in many investors requesting
redemptions.
As show in Figure 3,
$DJUSAG (red) and $SPX (black) have high positive correlation. |
| Figure 3. Relation between 1$DJUSAG (red) and $SPX (black; Source: stockchart.com) |
Figure 4. Margin Debt (Source:
@MFHoz)


