
Technical Analysis—Two Indexes Highly Correlated to $SPX
 |
| Figure 1. US Finanaical Asset Managers & Rydex Bull/Bear Asset Ratio (Source: @SuburbanDrone) |
Rydex Bull/Bear Asset Ratio
!RYRATMM is
- Rydex Asset Ratio - Bear + MM Assets/Bull Assets (NBD)
$ONE:!RYRATMM is the inverse of !RYRATMM (or 1 / !RYRATMM) , which represents:
- Rydex Bull/Bear Asset Ratio
As show in Figure2, 1/!RYRATMM (red) and $SPX (black) have high positive correlation.
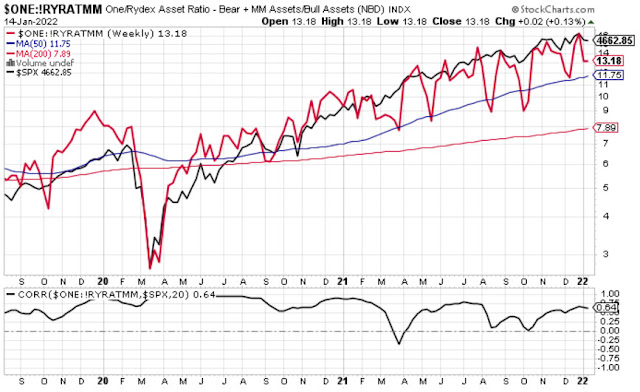 |
| Figure 2. Relation between 1/!RYRATMM (red) and $SPX (black; Source: stockchart.com) |
US Financial Asset Managers
As show in Figure 3, $DJUSAG (red) and $SPX (black) have high positive correlation.


Figure 4. Margin Debt (Source: @MFHoz)


Comments
Post a Comment