Posts

Showing posts with the label Liquidity

Understanding Options Contracts

Image
How To Choose An Options Contract (YouTube link ) The above video offers a basic overview of options trading, focusing on key factors when choosing an options contract. Consider the various expiration dates available. The choice depends on your trading strategy. For weekly trades, focus on the nearest expiration. For swing trades, opt for a later expiration date based on your expectations. Key Points: Platform: The speaker recommends Interactive Brokers Pro (IBKR Pro) for its fast execution speeds . Options Chain: This is the interface where you view available options contracts. Key Metrics: The most essential metrics include last price, net change, delta, open interest, volume, theta, bid, and ask . Delta: Measures the sensitivity of an option's price to changes in the underlying asset's price.  In other words, delta shows how much an option's price changes for each $1 move in the underlying stock .  Relationship between option price sensitivity (delta) and premi...

Gamma and Gamma Exposure—Knowing the Basics

Image
In 2021, $SPX options make up 16% of the $SPX market cap .  To hedge a book of $SPX options, the primary risk-management technique is delta hedging , which is when option traders start messing about in the equity markets.   Some may recall the Gamestop ( $GME ) saga that took place earlier this year - Much of this bizarre and explosive move was attributed to Gamma Exposure (GEX), which was a prime example of how the mechanics of gamma exposure can influence market action in a very powerful way.   Chart 1.  Estimated SPX Dealer Gamma Exposure - All Expirations (Source: @t1alpha ) Option Greeks   An option's price can be influenced by a number of factors that can either help or hurt traders depending on the type of positions they have taken. [1] Successful traders understand the factors that influence options pricing , which include the so-called " Greeks "— a set of risk measures so named after the Greek letters that denote them, which indicate how sensiti...

Index Liquidity versus Volatility Level

Image
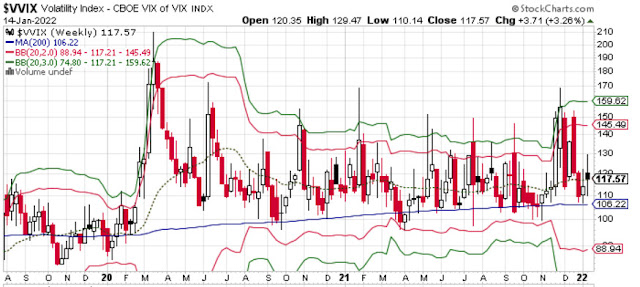
Market liquidity refers to the depth of buy and sell orders. A liquid market is one where you can buy or sell quickly. Volatility refers to a market's rate of change. A volatile market is one in which price changes rapidly over a short period of time.  Basically, the relationship between liquidity and volatility can be summarized as: Volatility  is related to several factors, and  liquidity  is only one of them In the context of  volatility , it means that there are always plenty of buyers and sellers whenever someone wants to buy or sell. Liquidity  keeps the bid-ask spread small. Liquidity by itself may not reduce the volatility of a stock, but a lack of liquidity can definitely cause wild volatility. Figure 1.   CBOE VIX of VIX Index (Source: stockchart.com) Volatility and the Amount of Consensus on Market Valuations In [3], Steve Sosnick wrote that the amount of volatility is inversely proportional to the amount of consensus about market v...

SKEW Index vs VIX Index

Image
Figure 1.  SKEW Index vs SPX Index In [1], it states that: Note the recent move lower in skew . Downside protection has become cheaper in terms of volatility (relatively speaking). Are we looking for a similar set up to the one we saw in September? Is Santa still alive? What's SKEW Index? The SKEW index is calculated using S&P 500 options that measure tail risk—returns two or more standard deviations from the mean—in S&P 500 returns over the next 30 days . The primary difference between the VIX and the SKEW is that the VIX is based upon implied volatility round the at-the-money (ATM) strike price while the  SKEW   considers implied volatility of out-of-the-money (OTM) strikes . SKEW  values generally range from 100 to 150 where the higher the rating, the higher the perceived tail risk and chance of a black swan event . A  SKEW  rating of 100 means the perceived distribution of S&P 500 returns is normal and, therefore, the probability of ...

Santa Claus Rally and January Effect

Image
Santa Claus Rally  A Santa Claus rally is a jump in stock prices, observed in the final five trading days of the year, typically starting a day after Christmas and going into the first two of January. Historically, this seven-day period has brought good news for investors, giving them another reason to cheer during the holiday season. [1] Why is that, you might ask? Here are some thoughts: [3] Some suspect that the Santa Claus rally is a result of general feelings of investor optimism around the holidays . Others point to the fact that many institutional investors , who tend to be more pessimistic about the markets, go on vacation around the holidays and leave the market to retail investors who are often more bullish . Other explanations include the investing of holiday bonuses, lower trading volumes around the holiday season, end-of-year tax considerations for institutions and holiday consumer spending boosting sales . Moreover, some say that the Santa Claus rally is a result...