
SKEW Index vs VIX Index
 |
| Figure 1. SKEW Index vs SPX Index |
In [1], it states that:
Note the recent move lower in skew. Downside protection has become cheaper in terms of volatility (relatively speaking). Are we looking for a similar set up to the one we saw in September? Is Santa still alive?
What's SKEW Index?
SKEW values generally range from 100 to 150 where the higher the rating, the higher the perceived tail risk and chance of a black swan event. A SKEW rating of 100 means the perceived distribution of S&P 500 returns is normal and, therefore, the probability of an outlier return is small.
Is SKEW Index a Good Indicator of Stock Market Volatility?
In practice, the SKEW index has been a poor indicator of stock market volatility. Financial writer Charlie Bilello observed data from the biggest one-day falls in the S&P 500 and the SKEW Index preceding these falls. "Going back to 1990, none of the worst declines had a SKEW Index in the prior month that was within the top 5% of historical values. So, when actual tail risk was present, SKEW did not predict it," Charlie Bilello said.[3]
Here are some reasons why the SKEW Index might not be a perfect predictor:
- Limited focus on specific types of volatility: The SKEW Index primarily focuses on tail risk, which are large, unexpected movements. However, major market crashes can sometimes be caused by more gradual and sustained periods of volatility that the SKEW Index might not capture.
- Influence of short-term factors: The SKEW Index is calculated based on options with a 30-day expiration date. This means it reflects market sentiment for the near future, but may not necessarily predict longer-term trends or major events.
- Psychological factors and market irrationality: Market crashes can often be driven by fear, panic, and irrational behavior, which are difficult to quantify and predict using purely technical indicators like the SKEW Index.
- The SKEW Index can still be a valuable tool for gauging overall market sentiment towards tail risk. A significantly high SKEW value might indicate increased investor anxiety and potential for larger-than-expected fluctuations.
- The SKEW Index can be used in conjunction with other technical and fundamental analysis tools to gain a more comprehensive understanding of market conditions and potential risks.
 |
| Figure 2. 1 month volatility vs 3 month volatility (Source: Refinitiv)[1] |
What's VIX Index?
The VIX Index is a leading indicator of the market's expectation of future volatility for the S&P 500 over the next 30 days. Calculated using implied volatilities from S&P 500 options, it helps gauge investor sentiment and potential risks.
Higher VIX values generally indicate increased fear and uncertainty, suggesting a greater likelihood of larger price movements in the near future. However, it's important to note that the VIX alone doesn't predict market crashes or guarantee volatility levels.
In absolute terms, VIX values > 30 indicates a greater likelihood of larger fluctuations resulting from increased uncertainty, risk, and investors’ fear. VIX values < 20 generally correspond to stable, stress-free periods in the markets.
Bear markets live and breathe between 20 and 30, and they will bleed people out between 30 and 50.
Warning: While VIX can be helpful in understanding market sentiment, investors should always consider other factors and conduct thorough analysis before making investment decisions.
In [1], it utilizes both SKEW and VIX for further interpretation:
When vols started outperforming and skew has come down aggressively as a lot of downside hedges have been offloaded (here and here). Let's see how this plays out from here, but should vols continue to "outperform", markets will calm down and the de-risked vol control players will need to chase stuff again.
where
- "Vols started outperforming": This refers to an increase in implied volatility (volatility expectations) as measured by VIX.
- "Skew has come down aggressively": This means the difference in implied volatility between out-of-the-money (OTM) and at-the-money (ATM) options has been decreasing. This suggests reduced concern about extreme price movements (either large ups or downs).
- "A lot of downside hedges have been offloaded": This implies that investors have reduced their positions in options used to protect against potential market downturns.
- "De-risked vol control players": This refers to investors or traders managing their exposure to volatility using various strategies.
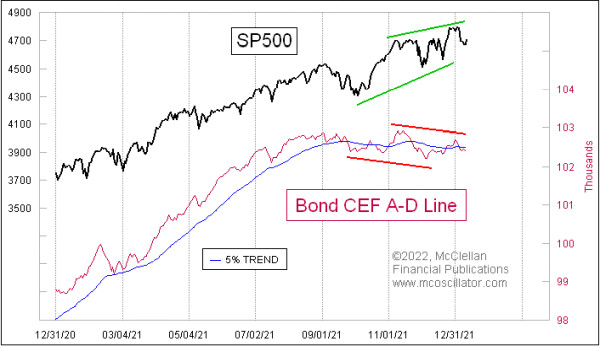 |
| Figure 3. The liquidity tides are going out (Source: @McClellanOsc) |
Liquidity and VIX
Do not underestimate the effects of liquidity withdrawal. The mammoth balance sheet the Fed has built up was a key determinant of liquidity across markets. As balance sheet runoff is put into motion, the withdrawal of liquidity will have profound impacts. Determining how it plays out is far from straightforward and will be determined by a variety of factors. Understanding the details matters. So hold on tight – there’s volatility ahead.
 |
| Figure 3. Correlation between liquidity and VIX—higher black line = tighter liquidity (Source: @Theimmigrant84) |


Comments
Post a Comment