Posts

Ichimoku Cloud System—Knowing the Basics

Image
Figure 1.  A chart of $SPXEW (on 12/02/2021) with the Ichimoku trading strategy Ichimoku Cloud System Ichimoku Cloud is a set of indicators designed as a standalone trading system. These indicators can be used to identify support and resistance, determine trend direction and generate trading signals. Ichimoku Kinko Hyo, the Japanese name for the technique, is translated as “one look equilibrium chart (一目均衡圖).” With one look, chartists can identify the trend and look for potential signals within that trend. For example, @Mayhem4Markets has used  Ichimoku Cloud  (see Figure 1 ) to analyze the trend of  $SPXEW  (S&P 500 equal weight) as follows:  $SPXEW  back in to the cloud here, neutralizing a near term downtrend potentially. Watch overhead resistance. I like using $SPXEW sometimes since it shows more about breadth (or the lack thereof) in its price action. In the opinion of  @ndshah26 , he also think high of  Ichimoku Cloud System : Gl...
Index Liquidity versus Volatility Level

Image
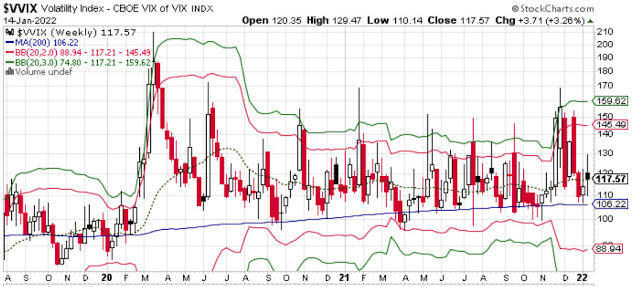
Market liquidity refers to the depth of buy and sell orders. A liquid market is one where you can buy or sell quickly. Volatility refers to a market's rate of change. A volatile market is one in which price changes rapidly over a short period of time.  Basically, the relationship between liquidity and volatility can be summarized as: Volatility  is related to several factors, and  liquidity  is only one of them In the context of  volatility , it means that there are always plenty of buyers and sellers whenever someone wants to buy or sell. Liquidity  keeps the bid-ask spread small. Liquidity by itself may not reduce the volatility of a stock, but a lack of liquidity can definitely cause wild volatility. Figure 1.   CBOE VIX of VIX Index (Source: stockchart.com) Volatility and the Amount of Consensus on Market Valuations In [3], Steve Sosnick wrote that the amount of volatility is inversely proportional to the amount of consensus about market v...

Technical Analysis—Two Indexes Highly Correlated to $SPX

Image
Figure 1.   US Finanaical Asset Managers & Rydex Bull/Bear Asset Ratio (Source: @SuburbanDrone ) Rydex Bull/Bear Asset Ratio !RYRATMM is  Rydex Asset Ratio - Bear + MM Assets/Bull Assets (NBD) $ONE: !RYRATMM  is the inverse of   !RYRATMM  (or 1 /  !RYRATMM ) , which represents: Rydex Bull/Bear Asset Ratio As show in Figure2,  1/!RYRATMM (red) and $SPX (black) h ave high positive correlation . Figure 2.   Relation between 1/!RYRATMM (red) and $SPX (black; Source:  stockchart.com ) US Financial Asset Managers Asset management stocks (e.g., STT , TROW , JEF ), once the bellwethers of Wall Street, fell out of favor spectacularly in 2018, with the Dow Jones U.S. Asset Managers Index ( $DJUSAG ) slumping 27% for the year, underperforming the S&P 500 by roughly 20%. The industry had margins squeezed from lower fees, a continuing shift toward passive products, capital expenditure on technology and increased compliance cost...

Options Expiration—Knowing the Basics

Image
There is an $SPX options expiration every Mon , Wed and Fri , and traditional monthly options expire every 3rd Friday of the month .  For example, this past Friday (08/19/2022)  is an option expiration week .  And here is what The Market Ear commented after this option expiration day: We had a relatively big "gamma roll off" post this expiration, the "stabilizer" is gone . Don't forget that we also flip into short gamma should the market move lower. Absolute levels to the downside are not big at the moment, but demand for downside protection could "kick in" again , leading to vol becoming bid, dealers selling deltas to delta hedge and the entire short gamma dynamics play out again. Option Expiration: A.M. or P.M. Every option contract has a specific expiration date, and time. The time of expiration can be either in the morning (a.m.) or in the afternoon (p.m.) . [1] Options that expire at the close of the market are considered p.m . and options tha...

SKEW Index vs VIX Index

Image
Figure 1.  SKEW Index vs SPX Index In [1], it states that: Note the recent move lower in skew . Downside protection has become cheaper in terms of volatility (relatively speaking). Are we looking for a similar set up to the one we saw in September? Is Santa still alive? What's SKEW Index? The SKEW index is calculated using S&P 500 options that measure tail risk—returns two or more standard deviations from the mean—in S&P 500 returns over the next 30 days . The primary difference between the VIX and the SKEW is that the VIX is based upon implied volatility round the at-the-money (ATM) strike price while the  SKEW   considers implied volatility of out-of-the-money (OTM) strikes . SKEW  values generally range from 100 to 150 where the higher the rating, the higher the perceived tail risk and chance of a black swan event . A  SKEW  rating of 100 means the perceived distribution of S&P 500 returns is normal and, therefore, the probability of ...

Santa Claus Rally and January Effect

Image
Santa Claus Rally  A Santa Claus rally is a jump in stock prices, observed in the final five trading days of the year, typically starting a day after Christmas and going into the first two of January. Historically, this seven-day period has brought good news for investors, giving them another reason to cheer during the holiday season. [1] Why is that, you might ask? Here are some thoughts: [3] Some suspect that the Santa Claus rally is a result of general feelings of investor optimism around the holidays . Others point to the fact that many institutional investors , who tend to be more pessimistic about the markets, go on vacation around the holidays and leave the market to retail investors who are often more bullish . Other explanations include the investing of holiday bonuses, lower trading volumes around the holiday season, end-of-year tax considerations for institutions and holiday consumer spending boosting sales . Moreover, some say that the Santa Claus rally is a result...

Goldman Sachs Hedge Fund Concentration Index (GSTHHVIP and GSTHVISP)

Image
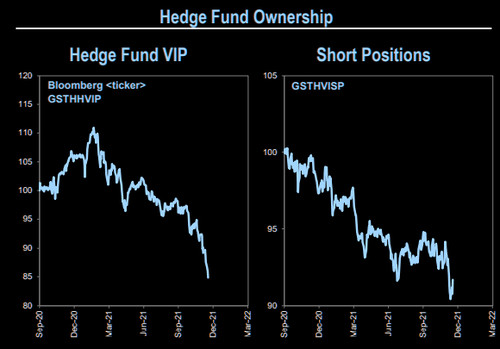
In an article named  Time to chase laggards? published on zerohedge.com website on 12/19/2021.  It asks a good question whether it's time to chase the laggards in the stock markets now.  One of laggards (i.e., it has performed very poorly lately) mentioned in the article is: hedge fund concentration (i.e., GSTHHVIP and GSTHVISP) Note that if a stock is on the "VIP" list, it means that a lot of hedge funds own it and if a stock on the "Most shorted" list, it means that a lot of hedgies hate it. Figure 1.  GSTHHVIP vs GSTHVISP (Source:  Goldman Sachs ) Goldman Sachs Hedge Fund VIP Index In [1], it describes the methodology for the Goldman Sachs Hedge Fund VIP Index: The Goldman Sachs Hedge Fund VIP Index (the “Index”) is owned by Goldman Sachs Asset Management L.P. (the “Index Sponsor”).  The Index is calculated by Solactive AG (the “Calculation Agent”).  The Index consists of hedge fund managers’ “Very-Important-Positions ,” or the US-listed stocks w...