Riding the Volatility Wave: A VIX-Based Approach to Election Investing
Here's the Real Reason Treasury Yields Are Rising (YouTube link)
Yield Curve Mystery: Why Did Yields Rise After the Fed Cut?
The speakers in the video above are discussing the recent rise in the 10-year Treasury yield following the Federal Reserve's 50-basis-point interest rate cut. They propose four potential explanations for this unexpected yield increase:
- A Head Fake: The yield rise is temporary and will soon reverse.
- Bond Vigilantes: Investors are concerned about rising deficits and national debt, leading them to demand higher yields on government bonds.
- Market Repositioning: Investors who had bet on a recession are now selling bonds as the economic outlook improves.
- A New Market Paradigm: Investors are anticipating higher growth and inflation in 2025, leading to increased demand for higher-yielding bonds.
The speakers from DataTrek Research lean towards the third or fourth explanation, suggesting that the market is shifting towards a new paradigm of stronger economic growth and higher inflation. They also acknowledge the possibility of a Fed policy mistake, given past errors in assessing economic conditions.
 |
| Current bond yields are similar to those seen in the 1960s and 2000s |
Nick Colas from DataTrek Research is arguing that despite significantly higher debt-to-GDP ratios compared to the past, current bond yields are similar to those seen in the 1960s and 2000s. This suggests that the market is not yet pricing in the risks associated with increased government debt. The speaker believes that factors like inflation expectations and real interest rates are more significant drivers of bond yields than debt levels. They argue that the current market environment is not indicative of an imminent debt crisis, and that the market is not yet fully pricing in the potential consequences of high debt levels.
How to Ride the Volatility Wave
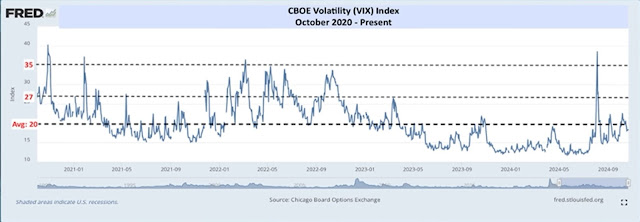
In the video above (from @29:13 to @30:59), Nick Colas and Josh Brown discuss the VIX chart shown to clients, emphasizing potential volatility from the upcoming election.
 |
| CBOE Volatility (VIX) Index (10/2020 - Present) |
Despite stable expectations, they acknowledge that surprises can happen. Historically, a VIX at 35 signals a good buying opportunity for the S&P 500, with an average gain of 6.5% over the next month. A VIX at 27 is also a useful indicator. They stress that these levels help in deciding when to buy amid market volatility, drawing on strategies used since the pandemic crisis. They're cautious but wouldn't be shocked to see the VIX hit 30 again.
Key Points
They're warning about potential market volatility ahead of the election. They suggest using these levels to buy stocks when the market is volatile.
- Historically, a VIX at 35 signals a good buying opportunity for the S&P 500, with an average gain of 6.5% over the next month.
- A VIX at 27 is also a useful indicator.


Comments
Post a Comment