Saturday, November 30, 2019

Proxies for US-and-China's Cycle—Lumber and Copper


In this article, we will illustrate both lumber and copper prices using the same technical indicators as described in a previous article:
Technical Analysis—Indicators that Identifies Overbought and Oversold levels
From the below charts, it seems to support Bloomberg's comment on 11/30/2019:
When it comes to financial markets, it looks like America is besting China. The U.S. economy however was off to modest start in the fourth quarter as consumers limited spending. More broadly, central bankers are worried what their cheap money policies may wreak.

Lumber Price


Copper Price


References

  1. Technical Analysis—Indicators that Identifies Overbought and Oversold levels

Sunday, November 10, 2019

Technical Analysis—Indicators that Identifies Overbought and Oversold levels

In [1], Victor Dergunov has used the below indicators to identity $SPX overbought levels:
  • Commodity Channel Index (CCI)
  • Relative Strength Index (RSI)
  • Full Stochastic Oscillator
In this article, we will use the same indicators to look at EWY (iShares MSCI South Korea Capped ETF NYSE).

Figure 1.  EWY chart on 11/08/2019


Relative Strength Index (RSI)


Relative Strength Index (RSI) is a momentum oscillator that measures the speed and change of price movements. RSI oscillates between zero and 100. According to Wilder, RSI is considered overbought when above 70 and oversold when below 30. Signals can also be generated by looking for divergences, failure swings and centerline crossovers. RSI can also be used to identify the general trend.

EWY (11/08/2019)
  • On 11/05/2019, the RSI was over 70 and now is back to 66.40.

Commodity Channel Index (CCI)


Commodity Channel Index (CCI) is a versatile indicator that can be used to identify a new trend or warn of extreme conditions. Lambert originally developed CCI to identify cyclical turns in commodities, but the indicator can be successfully applied to indices, ETFs, stocks and other securities. 

In general, CCI measures the current price level relative to an average price level over a given period of time. CCI is relatively high when prices are far above their average, but is relatively low when prices are far below their average. In this manner, CCI can be used to identify overbought and oversold levels.

The Commodity Channel Index (CCI) can be used as either a coincident or leading indicator.

Coincident Indicator
As a coincident indicator, surges above +100 reflect strong price action that can signal the start of an uptrend. Plunges below -100 reflect weak price action that can signal the start of a downtrend.

Leading Indicator
As a leading indicator, chartists can look for overbought or oversold conditions that may foreshadow a mean reversion. Similarly, bullish and bearish divergences can be used to detect early momentum shifts and anticipate trend reversals.

Full Stochastic Oscillator


When stocks trading in ranges, they are well suited for the Stochastic Oscillator.  There are three versions of the Stochastic Oscillator available on stockcharts.com
  • Slow Stochastic Oscillator
  • Fast Stochastic Oscillator
  • Full Stochastic Oscillator (Full STO)
Here we will cover only Full Stochastic Oscillator (Full STO).

The Full Stochastic Oscillator is a fully customizable version of the Slow Stochastic Oscillator. Users can set the look-back period, the number of periods for slow %K and the number of periods for the %D moving average. The default parameters were used in these examples: Fast Stochastic Oscillator (14,3), Slow Stochastic Oscillator (14,3) and Full Stochastic Oscillator (14,3,3).

When Full STO dips below 20 warn of oversold conditions that could foreshadow a bounce. Moves above 80 warn of overbought conditions that could foreshadow a decline. Notice how the oscillator can move above 80 and remain above 80 (orange highlights). Similarly, the oscillator moved below 20 and sometimes remained below 20. 

The indicator is both overbought AND strong when above 80. A subsequent move below 80 is needed to signal some sort of reversal or failure at resistance. Conversely, the oscillator is both oversold and weak when below 20. A move above 20 is needed to show an actual upturn and successful support test.

EWY (11/08/2019)
  • On 10/10/2019, the Full STO moved above 80 and remained above 80 until now (current: 83.09).

References

  1. S&P 500: Don't Get Too Comfortable, A Meltdown Could Occur At Any Moment
  2. S&P 500 Reaches Extreme Overbought Levels (08/15/2022)

Monday, October 7, 2019

Some Layman's Leading Recession Indicators

Figure 1.  Energy spikes preceded almost every recession

Below indicators will not try to time when the recession will come.  But, just add them to your prediction tool chest for monitoring purpose:
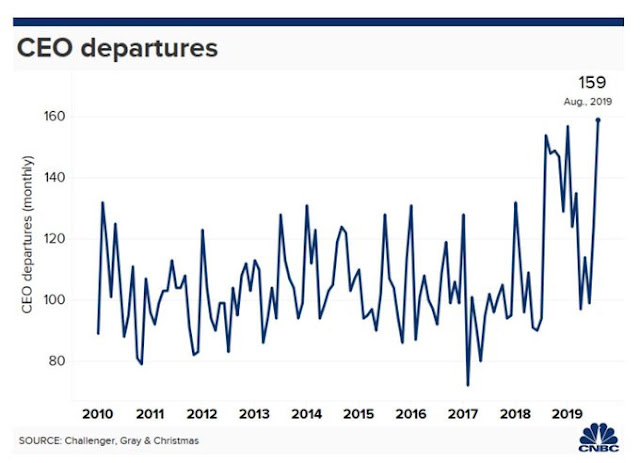
  1. CEO departures
  2. Bank layoffs[3,8,9]
  3. Heavy truck sales in the US are down 
    • This is one of the metrics Lyn Alden Schwartzer watch, because it tends to be a leading recession indicator.[2]
  4. Inverted yield curve[2,4]
  5. IPO trouble[2,4]
    • Some of these failed IPOs are another log on the recession risk bonfire, because now bondholders are at risk, employees are at risk, investors are starting to tone down their enthusiasm, etc.[2]
  6. High oil prices
    • Energy spikes preceded almost every recession for the last 80 years.[10]

Figure 1.  CEO departures tend be higher before the recession

References

  1. An Interesting Recession Indicator
  2. The Music Is Winding Down, But Opportunities Exist
  3. HSBC to cut up to 10,000 jobs in drive to slash costs: FT
  4. Inverted Yield Curve , Recession, and Market Top
  5. Fundamental Analysis—Renaissance IPO Index
  6. Propositions For A Recessionary Bear Market
    • The reason our Recession Warning Composite focuses on psychologically driven variables like stock prices, yield spreads, credit risk, and purchasing manager surveys is that few measures of "hard" economic activity reliably lead recessions.
    • By the time a U.S. recession begins, stocks have typically been in a bear market for months. 
    • Market tops are created because investors stop looking for a top, and simply extrapolate good news as a permanent feature of the economic landscape. Similarly, market bottoms are created because investors stop looking for a bottom, and extrapolate ongoing bad news.
  7. The Relentless Road To Recession Continued
  8. Global bank job cuts this year push past 70,000 mark. (Bloomberg)
  9. Morgan Stanley is cutting jobs due to uncertain global environment, sources say
  10. Another Strange Recession

Monday, September 30, 2019

Fundamental Analysis—Renaissance IPO Index

Figure 1.  Top 10 holdings of Renaissance IPO Index (source: Charles Schwab)


The Renaissance IPO Index is a portfolio of companies that have recently completed an initial public offering ("IPO") and are listed on a U.S. exchange.

Figure 2.  Recent IPOs are breaking down relative to the S&P 500

In [2], Bloomberg reported on 09/25/2019 that:
The 2019 class of IPOs includes a number of so-called unicorns, including high-profile market entrants like Uber Technologies Inc., Lyft Inc., and Pinterest Inc. Together, the unprofitable IPOs have already raised the most cash of any year since at least 2000, according to a Bloomberg analysis of listings worth $100 million or more.
In [4] , Financial Times reported on 11/22/2019 that:
But Bank of America investment strategist Jared Woodard offers a note of caution. 
Just 14 per cent of US tech IPOs are profitable this year, the last time that happened was at the dotcom peak in 2000 and we all know what happened after that,” he noted.


Figure 3.  Unprofitable Companies Are Raising the Most IPO Cash Since the Dot-Com Era 
Figure 4.  The cycles of IPO risk (source: Bloomberg)

References

  1. Renaissance IPO Index
  2. Unprofitable Companies Are Raising the Most IPO Cash Since the Dot-Com Era
  3. Goldman and Morgan Stanley expected to suffer IPO earnings hit (FT on 10/13/2019)
    • The tough IPO market has broader implications, especially for banks such as Goldman and Morgan Stanley, who rely on investment banking for a higher percentage of their earnings than universal banks such as JPMorgan Chase and Citigroup.
  4. A year in which the IPO market sobered up (11/22/2019)
    • So far 38 IPOs have been pulled this year, according to data provider Dealogic, compared with just eight in 2017. WeWork is the highest-profile example.

Friday, September 27, 2019

Fourth Turning—Crisis from 2008 to 2030

Video 1.  The Fourth Turning: Why American 'Crisis' May Last Until 2030 (YouTube link)


Video 2.  The Fourth Turning with Neil Howe on The Macro Show (YouTube link)


Video 3.  Neil Howe: The Fourth Turning Has Arrived (YouTube link)


According to the authors—Strauss and Howe, the Fourth Turning (roughly from 2008 to 2030) is a Crisis. This is an era of destruction, often involving war or revolution, in which institutional life is destroyed and rebuilt in response to a perceived threat to the nation's survival.


09/20/2021 SPX Monthly (source: @InvestingAngles)

As Robert Prechter. noted in a study he published in 2012 on Socionomic theory, proposes that unconscious social mood regulates social actions (including our willingness to buy stocks).

Interestingly, it seems to match approximately the prediction of the Elliott Wave Theory (EWT) which foresees that, after stock market reaches a peak in the year around 2022, it then will go through the a-b-c correction phase.  This correction phase will last roughly from 2022 to 2037.

On 10/02/2022, Avi—an EWT analyst—had commented that:[12]

One way or another, I am expecting a major bear market to begin and last at least 7-8 years, and potentially as long as 20.

Final Thoughts


Finally, if the authors Strauss and Howe are correct, "maybe" (note: not a prediction) the next debt will be burst by a civil unrest or another war in the future.

Updated (04/08/2020):
Analyst Dales Roberts has claimed that fighting Covid-19 is World War III in his article [2,3].
In a Foreign Policy piece, Nicholas Mulder highlights the way in which nations around the world have gone into wartime mindsets to fight the pandemic, both to control their populations and to mobilize resources and production. He connects the steps being taken today, such as enacting the Defense Production Act and instinctively using debt-financed federal spending to support the embattled citizenry, with those taken during the two world wars of the twentieth century. 
On a CNN report —U.S. Warships Enter Disputed Waters of South China Sea as Tensions With China Escalate, it states that:
  • The move comes as a war of words between the United States and China over the coronavirus pandemic intensifies

Video 4.  Elliot Wave and the Kondratiev Wave Together (YouTube link)


References

  1. If You Want Trump Out, You Need To Sell Your Stocks
  2. Fighting COVID-19 is World War 3 – Weekend Reads.
  3. The Reasons Why The Markets Will Go Much, Much Lower From Here
  4. The Coronavirus War Economy Will Change the World
  5. U.S. Warships Enter Disputed Waters of South China Sea as Tensions With China Escalate
    • The move comes as a war of words between the United States and China over the coronavirus pandemic intensifies.
  6. Kiril Sokoloff: ‘There will have to be massive debt relief’
    • In an interview with Rana Foroohar, the famous Wall Street strategist Kiril Sokoloff mentioned this book "The Fourth Turning" which he described as a very prophetic book.  
  7. "Losing The Bottom": Market Capitulates On The Idea That Normalization Is Ever Again Possible
    • This is also the reason why we remain steadfastly in the corner of hard assets as a world in which the only backstop of economic, monetary, political and social stability is accelerating dilution of fiat, means that currency collapse is only a matter of time.
  8. Why the US risks a new epidemic of violence (ft.com)
  9. The Changing World Order - Where We Are by Ray Dalio
  10. 10 "Big" Things For Stocks In The Coming Decade 
  11. What Will Not Change
  12. Sentiment Speaks: Market Approaching A Potentially Major Bottom (10/02/2022)

Saturday, September 21, 2019

Hedgeye's Macro Model―Growth, Inflation, Policy Model

"In The Arena" with Darius Dale & Daryl Jones (YouTube link)


Hedgeye's GIP model (i.e. Growth, Inflation, Policy Model) is a regime-based sort of framework. Both Dallio's Reserch and Hedgeye findings have proven that the two most important factors for investors to track the future financial market returns is the the rates of change in:
  • Growh 
  • Inflation.
as policymakers typically respond to subsequent levels on a lag.


From the rate changes, you get four possible outcomes, each of which is assigned a “quadrant” in their Growth, Inflation, Policy (GIP) model and the typical government response as a result (neutral, hawkish, in-a-box or dovish):
  • QUAD 1
    • Growth accelerating, Inflation slowing 
    • Monetary policy bias: Neutral
    • Market Narrative: Goldilocks
    • Normally, you see
      • Really positive for both equity and credit data across all sectors of the U.S. economy
        • The best quadrant for equity return
  • QUAD 2
    • Growth accelerating, Inflation accelerating
    • Monetary policy bias: Hawkish
    • Market Narrative: Reflation
    • Normally, you see
      • Economy is overheating
      • Bond yield rising
      • 2nd best quadrant for equity return
  • QUAD 3
    • Growth slowing, Inflation accelerating 
    • Monetary policy bias: Neutral
    • Market Narrative: Stagnation-to-Stagflation
    • Normally, you see
      • Late-cycle expansion
      • Stock-picker's & credit-picker's market
  • QUAD 4
    • Growth slowing, Inflation slowing 
    • Monetary policy bias: Dovish
    • Market Narrative: Deflation
    • Normally, you see
      • Quite negative for both equities and credit
        • Unless you invest in safe-haven asserts such as treasury bond, gold, and dollar
Senior Macro analyst Darius Dale at Hedgeye explains how their GIP Model can help investors proactively prepare their portfolios for “bouts of volatility,” recession and more.


Here’s a key excerpt.[2]
“If we can use our forecasting tools to sidestep bouts of volatility in particular asset classes, we can grow the net asset value of our portfolios in a much more risk reduced manner…What you see heading into a recession is that cycles tend to peak out in Quad 3… Then you slow into Quad 4 and that persistency of Quad 4, Quad 4 after Quad 4, is how recessions occur…We don't necessarily care about calling recessions because again, if we're set up for the asset allocations that history would suggest you should be in for Quad 4 and Quad 3 as well, then you don't necessarily have to make the recession call because you're already in the right types of assets that do well.”

References

  1. Growth, Inflation, Policy (GIP) Model
  2. "In The Arena" with Darius Dale & Daryl Jones
  3. Hedgeye's "Trade,Trend,Tail Process"
    • "Trade" is a duration of 3 weeks or less
    • "Trend" is a duration of 3 months or more
    • "Tail" is a duration of 3 years or less
  4. The World's Top Experts On Money & The Markets
    • Jim Grant, Lacy Hunt, Luke Gromen, James Rickards, Danielle DiMartino Booth, Brent Johnson, Lance Roberts, Tavi Costa, Rick Rule

Monday, September 2, 2019

REIT Investment Basics

In [10], Charles Schwab provides the case for REITs.  Here are the four reasons why REITs might deserve a place in your portfolio:

  1. Diversification
    • REITs rarely perform in lockstep with stocks or bonds due to the below reasons:
      • In recent years, the divergence was partly the result of low interest rates, which caused yield-hungry investors to drive REIT prices higher.
      • REITs tend to follow the real estate cycle, which typically lasts a decade or more, whereas bond- and stock-market cycles typically last an average of roughly 5.75 years.
  2. Income
    • In 2018, U.S. REITs yielded 4.88%.
  3. Inflation hedge
    • Real estate has tended to fare well in the face of rising prices.
    • REITs with commercial holdings frequently have agreements that allow them to raise rents in tandem with inflation.
  4. Long-term growth
If you choose to invest in REITs, do consider the following factors:
  • REITs are poor investments during periods of increasing interest rates, when rising yields from fixed income investments make REITs--which are risker--less attractive.
  • REIT dividends typically aren't treated as qualified dividends and will generally be taxed at higher ordinary income tax rates.
  • Because REITs tend to be volatile, they should constitute no more than 5% of your portfolio.[10]

What's a REIT?


A real estate investment trust (REIT) is
What are the different types of REITs? REITs can be:
  • Equity REITs
    • The majority of REITs are publicly traded equity REITs. Equity REITs own or operate income-producing real estate. 
    • In November 2014, equity REITs were recognized as a distinct asset class[6] in the Global Industry Classification Standard by S&P Dow Jones Indices and MSCI
  • mREITs (or mortgage REITs) 
    • Provide financing for income-producing real estate by purchasing or originating mortgages and mortgage-backed securities and earning income from the interest on these investments.
    • In [7], Jussi Askola claimed that mREITs (vs. Equity REITs) are quite different businesses and carry more risk.
    • In [6], Chuck Carnevale commented that Annaly Capital Management (NLY), Dynex Capital, Inc. (DX), and  AGNC Investment Corp. (AGNC) are not desirable for your retirement portfolios.
  • Public Non-listed REITs 
    • Public, non-listed REITs (PNLRs) are registered with the SEC but do not trade on national stock exchanges.
  • Private REITs 
    • Private REITs are offerings that are exempt from SEC registration and whose shares do not trade on national stock exchanges.  Do read [11] before you invest in private REITs.
The two main types of REITs are:

The key statistics to examine the financial position and operation of a REIT are:
  • Net asset value (NAV)
    • According to NAREIT, REIT share prices are currently trading at a premium over NAV of 12%.  In [6], Arturo Neto concluded that REITs are solid investments. But, they're looking pricey now (09/20/2019).
  • Net Operation Income (NIO)
  • Funds from operations (FFO)
    • Is a better indicator of a REIT's performance than the more traditional earnings per share reported by most other companies; in other words, FFO is to REITs what EPS is to other companies
  • Adjusted funds from operations (AFFO).

How does a company qualify as a REIT?

To qualify as a REIT a company must:
  • Invest at least 75% of its total assets in real estate
  • Derive at least 75% of its gross income from:
    • Rents from real property
    • Interest on mortgages financing real property 
    • Sales of real estate
  • Pay at least 90% of its taxable income in the form of shareholder dividends each year
  • Be an entity that is taxable as a corporation
  • Be managed by a board of directors or trustees
  • Have a minimum of 100 shareholders
  • Have no more than 50% of its shares held by five or fewer individuals

Table 1.  REIT preferred stocks paying roughly from 6% to 8% yield


Preferred REIT  


REIT preferred stock is a type of hybrid security with both equity- and bond-like characteristics. Within the capital structure of REIT companies, preferred stocks have a senior claim to earnings and dividends versus common stock but are generally junior to corporate bonds.

In [2], it states that REIT preferred stocks can:
  • Provide essential stability to a retirement portfolio.
  • Provide an effective path to withdrawals if you use them in a ladder
  • Excel in the expected flat or bearish bond markets
  • Be secure if History and logic imply that well-chosen
and it also provides a list of REIT preferred stocks paying roughly from 6% to 8% yield in Table 1.  You can consider them a starting point with due diligence.  Besides an investment's high yield, for example, you also need to consider the below factors:
  • Financial strength - the key to paying the dividend
  • Future growth - the key to raising it
  • Debt/Leverage - the weight pulling down the company


Simon Property Group


Simon Property Group's Preferred REIT (see Figure 1) as listed in Charles Schwab will be used as a case for further illustration.

Terminology:
  • Current Yield
    • Current Yield = Indicated Annual Rate / Share Price as of previous close
      • 5.80% = $4.19 / $72.25
  • Stated Call
    • A security with a stated call can be redeemed prior to maturity at the issuer's discretion on specified dates at specified prices. Callable securities are generally more risky for investors than non-callable securities because an investor is often faced with reinvesting proceeds at a lower, less attractive interest rate.
    • Stated Call Values
      • Yes: The security is callable, but a call notification has not been issued.
      • No: The security is not callable.
      • Call Scheduled: A call notification has been issued for this security.
  • Cumulative
    • A preferred security with a cumulative feature requires a company to make a dividend or interest distribution to shareholders of that security before any other distributions can be made to common shareholders. 
    • When a company fails to make a dividend or interest payment to preferred shareholders, the past omitted payments accrue and are paid in a future payment to a cumulative preferred shareholder before distributions can be made to any common shareholders.
  • Extraordinary Call
    • Investments with extraordinary call provisions provide an issuer the right to redeem a security before the maturity date due to unforeseen or unusual circumstances. 
    • Reasons an issuer might use an extraordinary call provision include asset sales, covenant violations, and tax law changes among other reasons. 
    • The terms of the redemption are stipulated in the official statement for the security. 
    • Securities with extraordinary call provisions require extra due diligence by investors. If you buy a security with an extraordinary call provision at a price above par value, and the security is called, you would generally receive par value, and forfeit any premium paid for the security.
  • Sinking Fund
    • An account to which the issuer must make periodic payments to be used to redeem specific outstanding securities. 
    • A sinking fund may be required by the official statement to improve the likelihood of repayment. 
    • If the issuer fails to make payments to the sinking fund, it can result in default.
  • Convertible
    • A convertible feature of a preferred security traditionally provides the right for the holder to exchange one type of security for another, such as the ability to convert a bond or preferred stock to the issuer’s common stock. 
    • There are instances, however, when this feature is provided to the issuer of the security, such as a mandatory conversion at a future date.


Figure 2.  Dividend / Coupon Features of SPG Preferred REIT (accessed on 09/02/2019 at Charles Schwab)

References

  1. What's a REIT?
  2. Sell Your Bonds! Buy REIT Preferreds Instead
  3. Guide to Equity REITs
  4. Guide to Mortgage REITs
  5. REITs Are Solid Investments, But They’re Looking Pricey (good)
  6. AGNC Investment Corp.: Not Suitable For Retirement Accounts
    • Companies with long histories of increasing their dividend every year are desirable, and companies that reduce or cut dividends are considered undesirable.
  7. Your REITs Will Vanish
  8. REITs Are A Buy: These Are The Ones Dividend Growth Investors Should Focus On
    • If payout ratio is below 65%, I'm very happy. I like a lower ratio for two reasons, the first is dividend safety and the second is the outlook for distribution increase.
  9. Your REIT Could Go Bankrupt (good)
  10. Charles Schwab OnInvesting (Summer 2019)
  11. What is happening now with private REITs is more important to markets than the FTX blow up. (must read)

Saturday, August 31, 2019

Commodity Investment Basics


Relative Performance of Equities to Commodities


The above chart shows cyclical moves in commodities relative to investing in the S&P 500, which can lead to potential investment opportunities in commodities.

The periods 1970-1974, 1987-1990 and 1998-2008 show outperformance of commodities relative to the S&P 500 on the order of 800% occur with cyclical regularity. Today’s geopolitical and economic conditions are deteriorating exacerbated by the US-China trade war and Hong Kong protests which are accelerating the reallocation to commodity.

Participating in this asset class transition could lead to dramatic investment performance outcomes that could impact investors and their lifestyles like those previous periods 1970-1974, 1987-1990 and 1998-2008 which encompassed four historic equity bear markets and commodity rallies.

Figure 2.  Soybean growing/export seasons (Brazil vs US)


Price Dynamics of Commodities


Each commodity has different price dynamics and could be impacted by different factors such as:
  • Copper (Symbol: COPX)
    • Based on [11], the risk/reward of investment in copper looks positive now because:
      1. Structural trends ahead are electrification, renewable energy, EVs, increased travel, and continuous, fast economic growth in developing countries with approximately 6 billion people. For all of that, you need copper.
      2. Copper is in limited supply to cater for the growth in demand, and prices are bound to increase. This creates a very positive risk/reward investment opportunity.
      3. The current sentiment, based on a myopic view of the situation, is negative, and copper miner stock prices are suppressed alongside other commodities.
  • Sugar (Symbol: CANE)
    • The price of sugar has been closing in on the lows under the weight of ample supplies and declines in the currency of the nation that is the world's leading producer and exporter of the sweet commodity.
    • Brazil is the world's leading producer and exporter of sugarcane. While sugar futures use the US dollar as the global pricing mechanism for the soft commodity, local costs are a function of local currency values. Therefore, the currency relationship between the US dollar and the Brazilian real has a significant influence on the price of sugar futures.
  • Gold (Symbol: GLD)
    • Based on seasonality, gold performs much better in the second half of the year than the first.
    • Central banks want to own more gold and this booming trend is only likely to continue in the coming years, said Australia and New Zealand Banking Group (ANZ).
    • Heightened global tensionscurrency wars, and a move to de-dollarize are driving emerging market central banks (e.g. Russia, Turkey, Kazakhstan and China) to boost their gold purchases.
    • Gold is a strategic asset, from a risk-adjusted returns perspective, so amid heightened economic and geopolitical risk, we see it benefiting from its safe-haven status.
    • Over very long periods of time, the gold price generally keeps up with the growth rate of money supply per-capita, because the amount of gold per person is relatively fixed while the number of dollars per person in existence keeps growing.[10]
  • Oil
    • Crude supply based on HFIR's analysis suggests Q4 2019 deficit will be massive[7]
Figure 3.  Crude Oil (CL) Seasonality


Commodity Investment in an Inflation Environment


Should long-term rates rise enough that inflation becomes a concern, investors could beef up commodity investments because of the following considerations:[1]
  • Safe havens
    • Commodities like gold and crude oil become havens
  • Inventory buildup
    • Governments of heavy commodity-importing nations may hoard inventory as they did in 2008, severely driving up prices of commodities such as wheat and copper
  • Diversification
    • Portfolio managers will turn to commodities as a way to diversify as they sell equities, which tend to suffer in high-interest rate environments as borrowing costs for businesses rise.

Andrew Hecht's Short-Term Investment Style


As a trader, Andrew Hecht love to use Leveraged ETN Products for intraday trading purposes.[2] However, He rarely if ever holds them overnight and has never kept a position for longer than one week as the theta risk outweighs the market risk, in his opinion.

His strategy over the years has been the same when it comes to these instruments. For example, he is a gold bull in the long-term and is always looking to add to his physical holdings. He tends to use his profits from trading the triple leveraged gold mining ETN products selecting direction based on his analysis of the path of least resistance for the yellow metal to buy gold bars and coins.

Gold continues to move higher and lower with the dollar on a daily basis these days and short-term trends have created profitable opportunities for trading the triple leveraged ETN mining products on a daily basis. DUSY and JDST can magnify results, but keep in mind that magnification causes a wild roller coaster ride with these products.

Commodity ETFs 


The most direct route for a risk position in the commodity market is via the futures and futures options on the Intercontinental Exchange.  Alternatively, you can use commodity ETFs as trading options.If you use ETFs as your trading tools, do check out below article:
An ETF Due Diligence Checklist

to help ensure the ETFs you choose best meet your needs.  For example, you need to consider the ETF AUM (Assets Under Management) for its stability or liquidity consideration.  The rule of thumb is:
While particulars vary, $50 million is commonly recognized as a stability point. Plus, greater AUM ➡ greater liquidity.
The below diagram shows an online survey result by State Street SPDR ETFs:

World GDP Growth and Commodity Price Returns


Below picture was tweeted by @GauravSaroliya.  He has also commented that commodity index is 75% oil.

References

  1. 5 Reasons Why Commodities Are the Place to Be in 2018
  2. While Gold Moves With The Dollar, Leveraged ETN Products Offer Short-Term Opportunities
  3. Hong Kong Protests Threaten This 10-Year-Old Bull Market
  4. Sugar Suffers From The Brazilian Real
  5. Global Oil-On-Water Suggests Q4 2019 Deficit Will Be Massive
  6. Central banks' love affair with gold continues as currency wars threaten outlook — ANZ
  7. Global Oil-On-Water Suggests Q4 2019 Deficit Will Be Massive
  8. Commodities ETFs
  9. An ETF Due Diligence Checklist
  10. I'm Still Loading Up On Gold And Gold Stocks. Here's Why
  11. Copper Will Boom; You'll Regret Not Having Portfolio Exposure
  12. UBS’s Billionaire Clients Are Betting on Big Gains From Energy
    • Almost half of the super-rich clients the bank surveyed said energy was attractive for future investment returns and business, the most among 21 categories overall, according to a report published on 12/08/2022. About a third of the 50 billionaires polled also viewed biotechnology, pharmaceuticals and software as attractive areas, the Zurich-based firm said. 
  13. Strategic Petroleum Reserve (Bloomberg 12/08/2022)
    • The potential is there to make the dream trade -- sell high, buy low. It could be a boon to the American driver.

Sunday, June 2, 2019

Cities with Best Quality of Life—Deutsche Bank

Below is the ranking of "Quality of Life Index" from "Mapping the World's Prices 2019" research paper published by Deutsche Bank.  The ranking is based on the following factors:
  • Purchasing Power Index 
  • Safety Index 
  • Health Care Index 
  • Cost of Living Index 
  • Property Price to Income Ratio 
  • Traffic Commute Time Index 
  • Pollution Index
  • Climate Index 


Want to live abroad but aren't ready to sacrifice your quality of life? These countries offer a higher standard of living at a discount based an article on Forbes—Top 8 Cheapest Places To Live Well Overseas In 2019:
  1. Lisbon, portugal
  2. Abruzzo, Italy
  3. Cali, Colombia
  4. Santo Domingo, Dominican
  5. Placencia, Belize
  6. Durango City, Mexico
  7. Da Nang, Vietnam
  8. Chiang Mai, Thailand

Saturday, March 2, 2019

Daniel O'Donnell—My Wild Irish Rose


My wild Irish Rose, 
the sweetest flower that grows.
You may search everywhere, 
but none can compare with my wild Irish Rose.
My wild Irish Rose, 
the dearest flower that grows,
And some day for my sake, 
she may let me take the bloom from my wild Irish Rose.


My wild Irish Rose, 
the sweetest flower that grows.
You may search everywhere, 
but none can compare with my wild Irish Rose.
My wild Irish Rose, 
the dearest flower that grows,
And some day for my sake, 
she may let me take the bloom from my wild Irish Rose.

Yes some day for my sake, 
she may let me take the bloom from my wild Irish Rose.


Songwriters: Mervyn Allan / Pd Traditional
My Wild Irish Rose lyrics © Warner/Chappell Music, Inc

Mark Twain Quotes


Thursday, February 7, 2019

Demis Roussos―Come, Waltz with Me

Video 1.  Demis Roussos - "Come, Waltz with Me" (YouTube link)


Come walk with me and 
let go of the way you are going
Come talk to me and 
I'll tell you what's really worth knowing
Life's much too good, 
my friend. Don't let it end.

Come dance with me and 
I'll give you a gift worth giving
Take a chance with me and 
I'll show you a life that's worth living
Life's much too good, 
my friend. Don't let it end.

Come waltz with me and 
let go of the way you are going
Come talk to me and 
I'll tell you what's really worth knowing
Life's much too good, 
my friend. Don't let it end.

Come dance with me and 
I'll give you a gift worth giving
Take a chance with me and 
I'll show you a life that's worth living
Life's much too good, 
my friend. Don't let it end.

Songwriters: 
Dmitri Dmitrijewitsch Schostakowitsch
John O C W Ewbank
Bert Gijsbertus C J Breda Van
Ed Eduard A J Edgar Starink


Saturday, January 5, 2019

Relation between VIX, S&P500 and the CDX-Index

The VIX-index is a measure of implied volatility in the S&P 500 and is often referred to as a fear index.  CDX.NA.IG is a credit default swap-index consisting of 125 North American investment grade companies and the S&P 500 is a stock index consisting of the 500 largest companies in USA.

In [1], authors use ordinary least square (OLS) regression to study if VIX can be explained by CDS and S&P 500. and find that the VIXCDX.NA.IG (will be referred as CDX in this article for short) and S&P 500 have a high correlation.

Figure 1.  A mean-reverting pattern of inverse relationship of VIX and S&P 500 played out cleanly in 2022.

VIX


VIX is measured as the weighted 30-day implied standard derivation of annual changes in S&P 500.  For example if the value of VIX is 20, then S&P 500 is expected to increase or decrease by 20% over the next year.[2]  This will be true in 68% of the cases, because standard deviation is in this case assumed to come from a normally distributed random variable, where 68% of the outcomes lies within one standard derivation fro  its mean.

Values of VIX above 30 are often observed in distressed markets while values below 30 are associated with calm periods.[3]

On 12/08/2022, Yahoo Finance has also published a similar observation from Jared Blikre.  Here is the gist of it:
  • Sell at 20 and buy at 35 are retro-fitted thresholds in the VIX for year 2022
  • It took about six weeks for the VIX to travel from 20 to 35 the last go-around
  • Also monitor the below developments for more clarity:
    • S&P 500 could flash a bullish signal by simply reclaiming its 200-day moving average to the upside.   This would likely (but not necessarily) occur in confluence with a simultaneous close over its 2022 negative trend line (the red line in the first chart), which would strengthen the signal.
    • The U.S. dollar could also add clarity 
      • Note that a strong dollar tightens financial conditions, which generally weighs on risk markets and commodities.

CDX.NA.IG


CDX stands for Credit Default Swap which is a credit derivative used to hedge the risk against a credit event such as a default on a bond issued by a company, it can be seen as insurance on credit loss.

By studying CDX, we get a sense of the credit risk associated by the companies.  The CDX indexes are broken out between investment grade (IG), high yield (HY), high volatility (HVOL), crossover (XO) and emerging market (EM).

CDX.NA.IG indices are comprised of 125 North American corporate credits that are Investment Grade when the index begins trading. Taking a position in the index allows traders to hedge or speculate.  Note that the 125 companies in CDX.NA.IG are also included in S&P 500.

Figure 2. A historical price chart of VIX and CDX.

Figure 3.  Current price chart of VIX and CDX.

Figure 4.  Current price chart of inverse VIX and S&P 500.

VIX and CDX


In Figure 2&3, we have shown a historical and a current price chart of VIX and CDX and, in Figure 4,  a current price chart of inverse VIX and S&P 500.

In [1], the authors has concluded that:
There is a strong positive correlation between VIX and CDX.NA.IG as well as a strong negative relationship between VIX and S&P 500.
Why we need to monitor both $VIX and CDX.NA.IG?  Alastair Williamson on Twitter has suggested that (01/04/2019):
With CDX NA IG coming back in, this is supportive of a bear market rally in the stock market, but the moment when spread widens again, that should be the top of the bear market rally
Once $VIX & CDX NA IG find meaningful unfair lows - that should mark the top of the bear market rally in the stock market 

References

  1. A study on the relation between VIX, S&P500 and the CDX-index
  2. Williams, M. (2013).  VIX: What Is It, What Does It Mean, And How To Use It.  Seeking Alpha
  3. Oeoutibem H, (2011).  Runnin' scared: VIX fear gauge spkies 35%. CNN
  4. The dollar holds the key to a burgeoning bull run in stocks: Morning Brief
  5. Why stock bulls are sitting on their hands again: Morning Brief