Posts

Proxies for US-and-China's Cycle—Lumber and Copper

Image
In this article, we will illustrate both lumber and copper prices using the same technical indicators as described in a previous article: Technical Analysis—Indicators that Identifies Overbought and Oversold levels From the below charts, it seems to support Bloomberg's comment on 11/30/2019: When it comes to financial markets, it looks like America is besting China . The U.S. economy however was off to modest start in the fourth quarter as consumers limited spending . More broadly, central bankers are worried what their cheap money policies may wreak . Lumber Price Copper Price References Technical Analysis—Indicators that Identifies Overbought and Oversold levels

Technical Analysis—Indicators that Identifies Overbought and Oversold levels

Image
In [1], Victor Dergunov  has used the below indicators to identity $SPX overbought levels: Commodity Channel Index (CCI) Relative Strength Index (RSI) Full Stochastic Oscillator In this article, we will use the same indicators to look at EWY (iShares MSCI South Korea Capped ETF NYSE). Figure 1.  EWY chart on 11/08/2019 Relative Strength Index (RSI) Relative Strength Index (RSI) is a momentum oscillator that measures the speed and change of price movements. RSI oscillates between zero and 100. According to Wilder, RSI is considered overbought when above 70 and oversold when below 30 . Signals can also be generated by looking for divergences, failure swings and centerline crossovers. RSI can also be used to identify the general trend. EWY (11/08/2019) On 11/05/2019, the RSI was over 70 and now is back to 66.40. Commodity Channel Index (CCI) Commodity Channel Index (CCI) is a versatile indicator that can be used to identify a new trend or warn o...

Some Layman's Leading Recession Indicators

Image
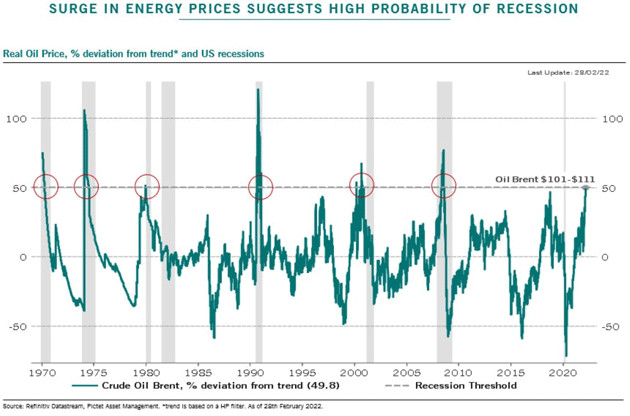
Figure 1.  Energy spikes preceded almost every recession Below indicators will not try to time when the recession will come.  But, just add them to your prediction tool chest for monitoring purpose: CEO departures Bank layoffs [3,8,9] Heavy truck sales in the US are down   This is one of the metrics Lyn Alden Schwartzer watch, because it tends to be a leading recession indicator. [2] Inverted yield curve [2,4] IPO trouble [2,4] Some of these failed IPOs are another log on the recession risk bonfire, because now bondholders are at risk, employees are at risk, investors are starting to tone down their enthusiasm, etc. [2] High oil prices Energy spikes preceded almost every recession for the last 80 years. [10] Figure 1.  CEO departures tend be higher before the recession References An Interesting Recession Indicator The Music Is Winding Down, But Opportunities Exist HSBC to cut up to 10,000 jobs in drive to slash costs: FT Inverted Yield Curve ...

Fundamental Analysis—Renaissance IPO Index

Image
Figure 1.  Top 10 holdings of Renaissance IPO Index (source: Charles Schwab) The Renaissance IPO Index is a portfolio of companies that have recently completed an initial public offering ("IPO") and are listed on a U.S. exchange. Figure 2.  Recent IPOs are breaking down relative to the S&P 500 In [2], Bloomberg reported on 09/25/2019 that: The 2019 class of IPOs includes a number of so-called unicorns, including high-profile market entrants like Uber Technologies Inc., Lyft Inc., and Pinterest Inc. Together, the unprofitable IPOs have already raised the most cash of any year since at least 2000 , according to a Bloomberg analysis of listings worth $100 million or more. In [4] , Financial Times reported on 11/22/2019 that: But Bank of America investment strategist Jared Woodard offers a note of caution.  “ Just 14 per cent of US tech IPOs are profitable this year, the last time that happened was at the dotcom peak in 2000 and we all kn...

Decoding the Fourth Turning: Why War, Debt, and Social Unrest Loom

Image
Video 1.  The Fourth Turning: Why American 'Crisis' May Last Until 2030 (YouTube link ) Video 2.  The Fourth Turning with Neil Howe on The Macro Show (YouTube link ) Video 3.  Neil Howe: The Fourth Turning Has Arrived (YouTube link ) According to the authors— Strauss and Howe , the Fourth Turning (roughly from 2008 to 2030) is a Crisis. This is an era of destruction, often involving war or revolution, in which institutional life is destroyed and rebuilt in response to a perceived threat to the nation's survival. 09/20/2021 SPX Monthly (source: @InvestingAngles) As Robert Prechter . noted in a study he published in 2012 on  Socionomic theory , proposes that unconscious social mood regulates social actions (including our willingness to buy stocks ). Interestingly, it seems to match approximately the prediction of the  Elliott Wave Theory (EWT) which foresees that, after stock market reaches a peak in the year around 2022, it then will ...

Hedgeye's Macro Model―Growth, Inflation, Policy Model

Image
"In The Arena" with Darius Dale & Daryl Jones (YouTube link ) Hedgeye 's GIP model (i.e.  G rowth, I nflation, P olicy Model) is a regime-based sort of framework. Both Dalio's Reserch and Hedgeye findings have proven that the two most important factors for investors to track the future financial market returns is the rates of change in: Growth  Inflation . as policymakers typically respond to subsequent levels on a lag. Quad Growth Inflation Nickname 1 Accelerating Decelerating Goldilocks 2 Accelerating Accelerating Reflation 3 Decelerating Accelerating Stagflation 4 Decelerating Decelerating Deflation Table 1. Hedgeye’s Quads are the core of their proprietary GIP Model (Growth, Inflation, Policy) Hedgeye’s inflation rate‑of‑change metric—a core i...

Invest in REITs: A Beginner’s Path to Financial Wellness

Image
REITs are influenced by real estate-specific factors like property demand, rental income, and interest rates, which differ from broader equity or bond market dynamics. This article's discussion of low interest rates reflects the pre-2019 environment, where REITs benefited from a low-rate regime. However, by 2025, rising interest rates have pressured REIT valuations, making this point less applicable today. ( Updated on May 20, 2025 ) In [10], Charles Schwab provides the case for REITs.  Here are the four reasons why REITs might deserve a place in your portfolio: Diversification REITs rarely perform in lockstep with stocks or bonds due to the below reasons: In recent years, the divergence was partly the result of low interest rates, which caused yield-hungry investors to drive REIT prices higher. REITs tend to follow the real estate cycle, which typically lasts a decade or more, whereas bond- and stock-market cycles typically last an average of roughly 5.75 years. Income ...