Wednesday, December 29, 2021

SKEW Index vs VIX Index

Figure 1.  SKEW Index vs SPX Index


In [1], it states that:
Note the recent move lower in skew. Downside protection has become cheaper in terms of volatility (relatively speaking). Are we looking for a similar set up to the one we saw in September? Is Santa still alive?


What's SKEW Index?


The SKEW index is calculated using S&P 500 options that measure tail risk—returns two or more standard deviations from the mean—in S&P 500 returns over the next 30 days. The primary difference between the VIX and the SKEW is that the VIX is based upon implied volatility round the at-the-money (ATM) strike price while the SKEW considers implied volatility of out-of-the-money (OTM) strikes.

SKEW values generally range from 100 to 150 where the higher the rating, the higher the perceived tail risk and chance of a black swan event. A SKEW rating of 100 means the perceived distribution of S&P 500 returns is normal and, therefore, the probability of an outlier return is small. 

Is SKEW Index a Good Indicator of Stock Market Volatility?


In practice, the SKEW index has been a poor indicator of stock market volatility. Financial writer Charlie Bilello observed data from the biggest one-day falls in the S&P 500 and the SKEW Index preceding these falls. "Going back to 1990, none of the worst declines had a SKEW Index in the prior month that was within the top 5% of historical values. So, when actual tail risk was present, SKEW did not predict it," Charlie Bilello said.[3]

Here are some reasons why the SKEW Index might not be a perfect predictor:
  • Limited focus on specific types of volatility: The SKEW Index primarily focuses on tail risk, which are large, unexpected movements. However, major market crashes can sometimes be caused by more gradual and sustained periods of volatility that the SKEW Index might not capture.
  • Influence of short-term factors: The SKEW Index is calculated based on options with a 30-day expiration date. This means it reflects market sentiment for the near future, but may not necessarily predict longer-term trends or major events.
  • Psychological factors and market irrationality: Market crashes can often be driven by fear, panic, and irrational behavior, which are difficult to quantify and predict using purely technical indicators like the SKEW Index.
However, it's important to note that:
  • The SKEW Index can still be a valuable tool for gauging overall market sentiment towards tail risk. A significantly high SKEW value might indicate increased investor anxiety and potential for larger-than-expected fluctuations.
  • The SKEW Index can be used in conjunction with other technical and fundamental analysis tools to gain a more comprehensive understanding of market conditions and potential risks.

Figure 2.  1 month volatility vs 3 month volatility (Source: Refinitiv)[1]

What's VIX Index?


The VIX is the first benchmark index introduced by Cboe to measure the market’s expectation of future volatility. Being a forward-looking index, it is constructed using the implied volatilities on S&P 500 index options and represents the market’s expectation of 30-day future volatility of the S&P 500 index, which is considered the leading indicator of the broad U.S. stock market.

The VIX Index is a leading indicator of the market's expectation of future volatility for the S&P 500 over the next 30 days. Calculated using implied volatilities from S&P 500 options, it helps gauge investor sentiment and potential risks.

Higher VIX values generally indicate increased fear and uncertainty, suggesting a greater likelihood of larger price movements in the near future. However, it's important to note that the VIX alone doesn't predict market crashes or guarantee volatility levels.

In absolute terms, VIX values > 30 indicates a greater likelihood of larger fluctuations resulting from increased uncertainty, risk, and investors’ fear. VIX values < 20 generally correspond to stable, stress-free periods in the markets.  
Bear markets live and breathe between 20 and 30, and they will bleed people out between 30 and 50.
Warning:  While VIX can be helpful in understanding market sentiment, investors should always consider other factors and conduct thorough analysis before making investment decisions.

In [1], it utilizes both SKEW and VIX for further interpretation:
When vols started outperforming and skew has come down aggressively as a lot of downside hedges have been offloaded (here and here). Let's see how this plays out from here, but should vols continue to "outperform", markets will calm down and the de-risked vol control players will need to chase stuff again.

where 

  • "Vols started outperforming": This refers to an increase in implied volatility (volatility expectations) as measured by VIX.
  • "Skew has come down aggressively": This means the difference in implied volatility between out-of-the-money (OTM) and at-the-money (ATM) options has been decreasing. This suggests reduced concern about extreme price movements (either large ups or downs).
  • "A lot of downside hedges have been offloaded": This implies that investors have reduced their positions in options used to protect against potential market downturns.
  • "De-risked vol control players": This refers to investors or traders managing their exposure to volatility using various strategies.

Figure 3.  The liquidity tides are going out (Source: @McClellanOsc)


Liquidity and VIX


The liquidity and the volatility normally correlate—Figure 4 shows the correlation between liquidity and VIX.  When ​the​ ​Fed ​winds down its​ QE​ ​​program​,​ ​it sucks ​​liquidity​ ​out​ ​of​ ​the​ system.  As reported by Morgan Stanley, it states that:[4]
Do not underestimate the effects of liquidity withdrawal. The mammoth balance sheet the Fed has built up was a key determinant of liquidity across markets. As balance sheet runoff is put into motion, the withdrawal of liquidity will have profound impacts. Determining how it plays out is far from straightforward and will be determined by a variety of factors. Understanding the details matters. So hold on tight – there’s volatility ahead.

Figure 3.  Correlation between liquidity and VIX—higher​ ​black​ ​line​ ​=​ ​tighter​ ​liquidity​ 
(Source: @Theimmigrant84)


References

  1. Skew, gamma, seasonality, low liquidity - say hello to the squeeze (12/21/2021)
  2. What Is the SKEW Index?
  3. Talk Markets. "The Risk of a Crash Has Never Been Higher
  4. Morgan Stanley: As The Fed's Balance Sheet Runoff Begins, The Withdrawal Of Liquidity Will Have Profound Impacts (ZeroHedge)

Tuesday, December 21, 2021

Santa Claus Rally and January Effect

Santa Claus Rally 


A Santa Claus rally is a jump in stock prices, observed in the final five trading days of the year, typically starting a day after Christmas and going into the first two of January. Historically, this seven-day period has brought good news for investors, giving them another reason to cheer during the holiday season.[1]

Why is that, you might ask? Here are some thoughts:[3]
Some suspect that the Santa Claus rally is a result of general feelings of investor optimism around the holidays. Others point to the fact that many institutional investors, who tend to be more pessimistic about the markets, go on vacation around the holidays and leave the market to retail investors who are often more bullish.

Other explanations include the investing of holiday bonuses, lower trading volumes around the holiday season, end-of-year tax considerations for institutions and holiday consumer spending boosting sales. Moreover, some say that the Santa Claus rally is a result of people buying stocks in anticipation of a rise of prices in January – a phenomenon known as the January Effect.

No matter the reason, this seven-day trading period is the second-best stretch for equities at any point in the year, with an average 1.3% gain since 1950.[4] Moreover, the seven-day combo produced positive returns nearly 78% of the time.[4]

January Effect


Figure 1.  January typically sees 134% of inflows (the rest of year average is 34%; Source: GS).[2]

Figure 2.  Seasonality based on the average of 1985-2019 (excluding 2008; Source: GS).[2]


Figure 3.  S&P 500 Index Seasonality (Source: Equity Clock).[2]

Relationship Between Liquidity, Volatility, and Technical Analysis


Based on his long-term experience, Justin Bennett warned that:[6,7]
  • Liquidity affects technical analysis
    • The more liquid a market is, the more reliable the technical is likely to be.
    • The decrease in liquidity around the month of December means that technical patterns become less effective. Markets also become prone to false breakouts.
    • The same can apply to Fridays when volume is lighter. If a market does break a key level just before the weekend, you may want to think twice before trading it on Monday.
  • Volatility can also affect the reliability of your analysis
    • You want to be careful when using a candle’s high or low that was the result of an extremely volatile session. Chances are the price will vary between brokers, making it an undesirable candle to use as part of your analysis.

References

  1. Jeffrey A. Hirsch. “The Little Book of Stock Market Cycles.” Page 170. John Wiley & Sons, 2012. Accessed Dec. 10, 2021.
  2. Skew, gamma, seasonality, low liquidity - say hello to the squeeze
  3. What is the Santa Claus rally?
  4. LPL Research, “Do You Believe In The Santa Claus Rally?” (December 2020)
  5. Chart Advisor: Santa Claus Rally
  6. How Are Market Liquidity and Volatility Related?
  7. How Volatility Can Sabotage Your Technical Analysis

Sunday, December 19, 2021

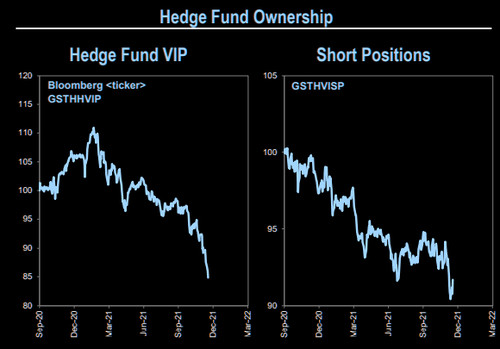
Goldman Sachs Hedge Fund Concentration Index (GSTHHVIP and GSTHVISP)

In an article named 

published on zerohedge.com website on 12/19/2021.  It asks a good question whether it's time to chase the laggards in the stock markets now.  One of laggards (i.e., it has performed very poorly lately) mentioned in the article is:
hedge fund concentration (i.e., GSTHHVIP and GSTHVISP)
Note that if a stock is on the "VIP" list, it means that a lot of hedge funds own it and if a stock on the "Most shorted" list, it means that a lot of hedgies hate it.


Figure 1.  GSTHHVIP vs GSTHVISP (Source: Goldman Sachs)


Goldman Sachs Hedge Fund VIP Index


In [1], it describes the methodology for the Goldman Sachs Hedge Fund VIP Index:
The Goldman Sachs Hedge Fund VIP Index (the “Index”) is owned by Goldman Sachs Asset Management L.P. (the “Index Sponsor”).  The Index is calculated by Solactive AG (the “Calculation Agent”). 
The Index consists of hedge fund managers’ “Very-Important-Positions,” or the US-listed stocks whose performance is expected to influence the long portfolios of hedge funds. Those stocks are defined as the positions that appear most frequently among the top 10 long equity holdings within the portfolios of fundamentally-driven hedge fund managers
The Index is rebalanced on a quarterly basis to reflect changes in reported hedge fund manager holdings.
You can read a tutorial on Goldman Sack's Financial Series to learn how to interact with financial data series. It'll walk through some examples of how to retrieve and visualize market data in order to analyze the performance of different assets.

Goldman Sachs Very Important Short Positions For Hedge Fund


Reported on 01/28/2021 by Barron's, it describes GSTHVISP as the below:
Goldman Sachs publishes a report that looks at the holdings of 814 hedge funds with $2.4 trillion of gross equity positions. 
As of the start of the fourth quarter 2020, the most recent report available, 10 of the stocks Goldman calls “very important short positions” for hedge funds with the highest short interest included: 
  1. C.H. Robinson Worldwide (CHRW)  
  2. Advanced Micro Devices (AMD)
  3. Aon (AON)
  4. Duke Energy (DUK)
  5. Analog Devices (ADI)
  6. Kroger (KR)
  7. Simon Property (SPG)
  8. Hormel Foods (HRL)
  9. Willis Towers Watson (WLTW)
  10. Chipotle Mexican Grille (CMG).
Note that high short interest is, essentially, a high percentage of total shares available for trading borrowed and sold by bearish investors betting on price declines. It can exacerbate a stock’s price rise in a short squeeze because investors like hedge funds, who for the most part are active short sellers, have to buy more shares to cover bets as losses mount.