Friday, June 20, 2025

Trump’s Tariff-Driven Currency Reset: A Treasury Market Time Bomb?

Trump’s New Currency Plan Just Set Off A Treasury Time Bomb (YouTube link)


In the video above, the discussion revolves around the U.S. dollar’s role as the global reserve currency, its cyclical strength, and potential policy shifts under a Trump administration, as outlined in the GOP platform. 


Key Points


Here’re the key points:

U.S. Dollar as Global Reserve Currency:

  • The GOP platform emphasizes maintaining the U.S. dollar as the world’s reserve currency, a position explicitly supported by Trump and his proposed Treasury team.
  • Despite this, there’s an acknowledgment of trade imbalances, which are linked to the dollar’s reserve status. Addressing trade deficits while preserving the dollar’s dominance presents a complex challenge, as these are interconnected issues.

Key Figures and Policy Insights:

  • Stephen Miran is highlighted as a key economic adviser who understands the nuances of dollar policy. His work suggests that some proposed policies might initially strengthen the dollar but could lead to deliberate weakening later.
  • The distinction is made between the dollar’s cyclical strength (short-term fluctuations driven by economic conditions) and its structural role as the global reserve currency.

Dollar Policy and Trade-offs:

  • Trump has previously criticized other currencies for being "unfairly cheap," suggesting a focus on exchange rate differentials in trade negotiations. This could involve intentional dollar devaluation to address trade imbalances.
  • Policies like tariffs and trade concessions might precede a deliberate dollar weakening to boost U.S. exports, but this risks inflation due to higher import and energy prices.
  • There’s discussion of disincentivizing foreign holdings of U.S. assets (e.g., Treasuries), which artificially inflate U.S. asset values and the dollar’s exchange rate. Reducing foreign demand could weaken the dollar but disrupt markets.

Economic and Political Challenges:

  • Reversing long-standing economic trends (e.g., trade deficits and dollar strength) would create winners and losers. Sectors benefiting from a strong dollar (e.g., finance, importers) might resist, while exporters and manufacturers could gain.
  • The complexity of reversing these trends lies in the trade-offs: weakening the dollar could ease global debt burdens (especially for emerging markets with dollar-denominated debt) but risks domestic inflation and market turbulence.
  • Politicians, including Trump’s team, may downplay these downsides, promising benefits (e.g., trade balance) while minimizing costs (e.g., inflation, deficits), a common political strategy.

Global Economic Context:

  • The U.S. has benefited from a unipolar world since the Soviet Union’s collapse, fostering international cooperation but allowing trade imbalances to grow (e.g., U.S. trade deficits, Eurozone issues).
  • The world is shifting toward a multipolar system, with countries or blocs acting more independently. Trump’s team aims to mitigate policy downsides by pushing costs onto other nations, though some domestic fallout is likely.

Dollar Cycles and Historical Precedents:

  • The dollar has experienced three major cycles since the Bretton Woods system ended in 1971: strong in the 1980s (leading to the Plaza Accord), strong in the late 1990s, and strong since around 2014.
  • The current strong dollar cycle (since 2014) has been prolonged by global factors, including:
    • Weak growth in other regions (e.g., Canada’s energy policy limitations, Europe’s loss of Russian gas, China’s property bubble and tech crackdowns).
    • Investors see the U.S. as the "only game in town" due to these "own goals" by other economies.
  • The Plaza Accord (1985) is cited as a precedent for intentional dollar weakening to address trade imbalances, driven by Japan and Taiwan’s competitive exports. A similar move (e.g., a “Mar-a-Lago Accord”) could be considered to reset the current cycle.

Market Dynamics and Risks:

  • A strong dollar reduces foreign demand for U.S. debt, as seen in the past decade, with foreign central banks holding fewer Treasuries. Private-sector buying hasn’t fully offset this.
  • In 2020, a dollar spike during the COVID crash caused a Treasury market breakdown, requiring Federal Reserve intervention (QE and swap lines). This illustrates the risks of a strong dollar environment.
  • Globally, $13 trillion in dollar-denominated debt outside the U.S. creates demand for dollars, but a strong dollar strains borrowers, slows global growth, and can lead to asset sales (e.g., Treasuries), causing U.S. market volatility (e.g., 2020, 2022).

Potential Outcomes:

  • A deliberate dollar weakening could ease debt burdens for emerging markets, boost their economies, and indirectly support U.S. asset prices and growth.
  • However, this risks “sticky” inflation due to higher import and energy costs, a trade-off that may not be fully acknowledged by policymakers.
  • Post-election dollar surges (e.g., after Trump’s election) reflect expectations of lo ‘looser fiscal policy and higher inflation, potentially requiring a hawkish Fed response, which could temporarily strengthen the dollar further.

Speculative Future Moves:

  • Trump’s focus on currency differentials suggests negotiations may include currency components alongside tariffs.
  • A major cycle-ending move, like the Plaza Accord, could initiate a new 10-15-year dollar cycle, potentially stabilizing trade but requiring careful management to avoid excessive inflation or market disruption.

Conclusion

In summary, the discussion highlights the tension between maintaining the dollar’s reserve status and addressing trade imbalances. Trump’s team, led by figures like Stephen Miran, may pursue policies that initially strengthen the dollar but later involve deliberate weakening to boost exports, with risks of inflation and market pushback. Historical precedents like the Plaza Accord suggest such moves are feasible but complex, with global and domestic economic implications. The shift to a multipolar world complicates these dynamics, and policymakers may minimize the costs of these trade-offs to sell their agenda.

Tuesday, June 17, 2025

Paul Tudor Jones on Fed Chair, Trump Budget, Markets, and AI: Insights and Warnings (Jun 11, 2025)

Tudor Jones on Next Fed Chair, Trump Budget, Markets, AI (YouTube link)

Paul Tudor Jones, a prominent hedge fund manager, shared his views on various economic and investment topics during a discussion. Here's a summary of the key points:


Key Points

  • Robin Hood Foundation Competition: Jones discussed a successful fundraising event for the Robin Hood Foundation, raising $400,000, with Bill Ackman, Mark Gilbert, and Stan Druckenmiller as top performers. The competition involves a six-month long and short investment bet, and Jones hopes to expand it with more female participants.
  • Yield Curve and Fed Chair: Jones is bullish on the yield curve steepening, expecting lower front-end rates due to a new, dovish Federal Reserve chair under President Trump by mid-2026. He believes a dovish Fed is necessary to manage the U.S.'s fiscal constraints and high debt-to-GDP ratio (100%) by running negative real rates to lower interest costs.
  • U.S. Deficit and Budget: Jones expressed concerns about persistent 6%+ budget deficits, calling Trump's budget plan the "big beautiful bill." To balance the budget, he suggested drastic measures like a 6% across-the-board spending cut and significant tax hikes (e.g., 49% top income rate, 1% wealth tax, 40% capital gains rate). He believes bond markets may eventually force fiscal discipline, though the timing is uncertain.
  • Investment Strategy: Jones predicts a weaker U.S. dollar (down 10% in a year) and a steeper yield curve. For a portfolio in a debt-trap scenario, he recommends a mix of stocks, gold, and Bitcoin (1-2% allocation) to hedge inflation. He sees equities as vulnerable if bond markets react negatively to fiscal profligacy.
  • AI and Investment: Jones is enthusiastic about AI's potential to democratize quantitative modeling in finance, reducing barriers to entry for smaller firms. However, he avoids specific stock picks, focusing on AI's broader disruptive impact. He tested new AI models at his firm, noting their rapid improvement.
  • AI Risks and Regulation: Jones warned of AI's societal risks, citing Elon Musk's 20% chance of AI wiping out humanity and potential white-collar job displacement (10-20% unemployment in 1-5 years). He criticized the lack of regulatory guardrails in Trump's "big beautiful bill" and called for thoughtful discussions on AI governance to balance productivity gains with social stability.
  • Social and Economic Inequality: Jones highlighted the uneven distribution of productivity gains since the 1980s (85% to the top 10%), fueling divisiveness and distrust. He supports ideas like "Invest America" to give children investment accounts to foster capitalism's benefits and suggested taxing AI or robotics to redistribute wealth more equitably.

Conclusion


Jones advocates for fiscal caution, strategic investing around a dovish Fed, and proactive AI regulation to mitigate risks while harnessing its benefits.

Jeffrey Gundlach on U.S. Debt Crisis, Treasury Yields, and Global Investment Shifts (Jun 11, 2025)

Gundlach on Treasuries, Gold, Fed, AI, Private Credit, Trump (YouTube link)

In the video above, the speaker, Jeffrey Gundlach, focuses on the unsustainable fiscal path of the United States, highlighting concerns about rising national debt, increasing interest expenses, and shifting market dynamics that suggest a potential reckoning in financial markets. Below is a detailed summary of the key points raised:


Key Points


1. U.S. Fiscal Unsustainability and Rising Debt

  • National Debt: The U.S. is approaching a $37 trillion national debt, currently at approximately $36.95 trillion, with rapid growth. This trajectory is seen as unsustainable due to persistent budget deficits.
  • Interest Expense: The average coupon on U.S. Treasuries has risen significantly, from below 2% to around 4%. As older, low-yield bonds (e.g., 0.25% coupons issued in 2009 or 2019) mature, they are being replaced with higher-yield bonds (e.g., 4.25%), increasing the government's interest burden by 400 basis points on maturing debt. This rising cost is viewed as untenable given the size of the deficit.
  • Market Awareness: There is growing recognition in the markets that the U.S. fiscal situation is precarious, which is reflected in the behavior of long-term Treasury bonds and other financial indicators.

2. Unusual Market Behavior

  • Dollar Index Movement: Historically, during S&P 500 corrections (drops of more than 10%), the trade-weighted U.S. dollar index typically rises as investors seek safety. However, in the most recent 20% S&P 500 decline, the dollar weakened, which is an anomaly compared to the past 15 years. This suggests a shift in investor confidence in the dollar.
  • Treasury Yields and Yield Curve: Normally, when the Federal Reserve cuts interest rates, yields across the Treasury yield curve decline. However, since the Fed began cutting rates in September 2023, the 10-year Treasury yield has risen, and the yield curve is steepening. This indicates that long-term Treasuries are not behaving as traditional "flight to quality" assets.
  • Long-Term Treasuries: The long-term Treasury bond is losing its status as a safe-haven asset. It is not responding to lower interest rates or an inflation rate of around 2.5%, which may rise further. This shift is attributed to concerns about the U.S. fiscal situation and the increasing interest expense.

3. Inflation Outlook

  • Recent Data: The cumulative headline CPI (Consumer Price Index) for the latest month was 0.18%, but the rolling-off figure from a year ago was 0.1%. Over the next two months, the cumulative rise is expected to be 0.1%, suggesting that inflation may be at a near-term low but could increase.
  • Implications: Rising inflation could exacerbate the challenges of managing the national debt and interest expenses, further pressuring Treasury yields.

4. Capital Flows and Dollar Weakness

  • Net Investment Position: Over the past 15–17 years, the U.S. has seen significant foreign investment, with a net investment position growing from $3 trillion to over $25 trillion. However, the dollar is now weakening, raising concerns that some of this capital could exit the U.S.
  • Investment Strategy: The speaker suggests that dollar-based investors should consider increasing allocations to non-dollar assets, such as foreign currencies or emerging market equities, to hedge against potential capital outflows and dollar depreciation.

5. Long-Term Treasury Bonds and Quantitative Easing (QE)

  • Potential Pivot: If Treasury yields, particularly on the 30-year bond, rise to an "uncomfortably high" level (e.g., 6%), the U.S. government may face a $5 trillion budget deficit due to increased borrowing costs. This could force a policy pivot, with quantitative easing (QE) being a likely response, where the Federal Reserve would buy long-term Treasuries to suppress yields.
  • Market Opportunity: If QE is announced, long-term Treasuries could rally significantly (e.g., a 20-point price increase, equivalent to a 100 basis point drop in yield). Investors would need to act quickly to capitalize on this, ideally before the announcement, though such timing is difficult without insider information.
  • Paradigm Shift: The speaker emphasizes a "tremendous paradigm shift" where long-term Treasuries are no longer a reliable safe-haven asset, and money is not flowing into the U.S. as it once did.

6. Gold as a Safe-Haven Asset

  • Rising Demand: Gold has emerged as a new flight-to-quality asset, with retail demand surging (e.g., Costco struggling to keep gold in stock). Central banks have been accumulating gold after selling it at lower prices ($300–$400/oz) and buying it back at higher prices (around $3,000/oz).
  • Price Performance: Gold has risen from $1,800/oz to over $2,000/oz, with a 40%+ year-to-date gain, outperforming or matching assets like Bitcoin. The speaker views gold as a legitimate asset class, no longer just for "lunatic survivalists."
  • Investment Recommendation: For investors considering volatile assets like Bitcoin, the speaker suggests leveraging gold (e.g., 2x leverage) as a less risky alternative with similar upside potential.

7. Corporate Debt and Credit Markets

  • Reduced Exposure: The speaker’s firm (DoubleLine) has significantly reduced its allocation to below-investment-grade debt and leverage in its closed-end funds, with leverage at historic lows (e.g., 45% in one fund, 7% in another). This cautious approach is driven by a desire to act as a liquidity provider during market dislocations.
  • Market Valuations: The S&P 500 is described as "incredibly uninteresting" due to high valuations, with forward P/E ratios exceeding all-time highs from early 2025. Earnings estimates have been cut, yet the market remains overvalued, reminiscent of 1999 (dot-com bubble) and 2006–2007 (pre-financial crisis).
  • Credit Market Risks: The corporate debt market is showing signs of frothiness, with private credit heavily invested and potentially overvalued. The speaker draws parallels to the collateralized debt obligation (CDO) market in 2006–2007, where excessive enthusiasm preceded a crash.

8. Private Credit Concerns

  • Overinvestment: Private credit has become a popular investment, with institutions like Harvard’s $53 billion endowment facing liquidity issues, forcing them to issue bonds and consider selling private equity stakes at a discount. This suggests systemic overexposure to illiquid assets.
  • Weak Arguments: The speaker critiques the arguments for private credit:
    • Volatility: Claims that private credit is less volatile than public markets are misleading, as it can still experience significant mark-downs.
    • Historical Performance: Past outperformance is not a reliable indicator of future results, especially as public credit has recently outperformed private credit.
    • Liquidity Risks: Private credit lacks liquidity, which could lead to forced selling during a market downturn, as seen with endowments like Harvard and Stanford in 2008.
  • Potential for Forced Selling: If institutions need liquidity, they may be forced to sell private credit or equity holdings at steep discounts, creating opportunities for buyers but risks for overexposed investors.

9. Historical Context and Market Cycles

  • Long-Term Cycles: The speaker references the "Fourth Turning" concept by Neil Howe, which describes generational cycles where societies undergo major restructuring every 80–100 years. The U.S. is in such a phase, with issues like wealth inequality, calcified property relations, and disruptive technological change (e.g., AI) driving systemic challenges.
  • Wealth Inequality: The concentration of wealth and power has created a "feudal" system of lords and serfs, necessitating a restructuring of institutions, political systems, and finances.
  • Market Analogies: The current market environment is compared to the dot-com bubble (1999) and the pre-financial crisis period (2006–2007), with overhyped sectors like AI drawing parallels to electricity stocks in the early 20th century. While transformative, these sectors often see excessive enthusiasm that leads to corrections.

10. Investment Opportunities and Strategies

  • Emerging Markets: The speaker recommends selective emerging market equities, particularly in countries like India, which has demographic and economic similarities to China 35 years ago. India benefits from supply chain shifts and technological advancements, making it a long-term investment opportunity.
  • Foreign Currencies: Dollar-based investors should consider foreign currencies to diversify away from a potentially weakening dollar. The S&P 500 is underperforming compared to MSCI Europe, and emerging markets may offer currency translation benefits.
  • Waiting for Opportunities: The speaker advocates a defensive stance, holding cash and gold while waiting for a market correction. A significant credit market break (e.g., bonds dropping 30 points) could create buying opportunities, particularly in high-yield bonds, which could recover quickly.
  • Timing: The years 2027–2028 are highlighted as a potential "window of tremendous opportunity" due to an expected worsening of the Treasury problem and broader market dislocations.

11. Global vs. U.S. Problem

  • Global Issue: The fiscal and market challenges are not unique to the U.S. but are global in nature. Investors cannot fully escape by diversifying into Europe or Japan, as these regions face similar issues.
  • Long-Term Themes: Investing in assets with strong long-term growth potential, such as India or gold, is recommended as a way to navigate the global challenges.

12. Behavioral and Psychological Factors

  • Need as a Driver: The speaker emphasizes that "need" (e.g., institutions needing liquidity) is a stronger driver of investment behavior than fear or greed. Examples include endowments unable to meet capital calls in 2008 and universities seeking high returns in low-rate environments (e.g., 1993–1994).
  • Market Timing: Markets take longer to break than expected, but when they do, they decline rapidly ("stairs up, elevator down"). Investors must be patient but ready to act when opportunities arise.


Conclusion


The speaker, Jeffrey Gundlach,  paints a picture of a U.S. economy on an unsustainable fiscal path, with rising debt, increasing interest expenses, and shifting market dynamics signaling a potential crisis. Long-term Treasuries are losing their safe-haven status, the dollar is weakening, and gold is emerging as a preferred asset. Investors are advised to reduce exposure to overvalued assets like the S&P 500 and private credit, diversify into non-dollar investments, and prepare for opportunities in 2027–2028 when market dislocations could create significant buying opportunities. The broader context involves a global need for restructuring due to wealth inequality and technological disruption, with long-term investments in emerging markets like India and assets like gold recommended as hedges against these challenges.

Saturday, June 14, 2025

Revealing True Purchasing Power: Nominal vs. PPP GDP Per Capita

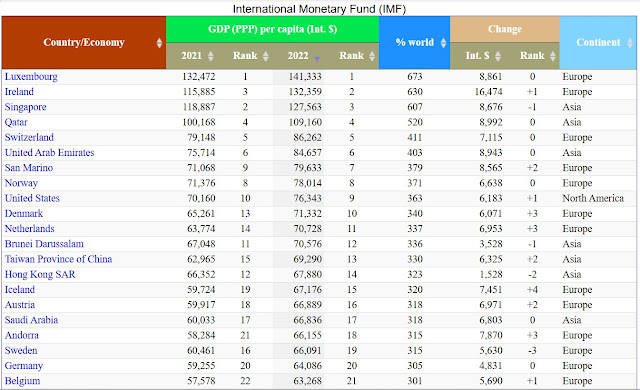
Top 21 countries ranked by PPP GDP per capita (source: StatisticsTimes.com)

GDP per Capita


Below is a summary of the ZeroHedge article "These Are The 50 Richest Countries By GDP Per Capita," published on June 13, 2025, which ranks the top 50 countries by nominal GDP per capita in 2025 based on IMF projections. All figures are in current USD, unadjusted for cost of living.

Overview: 
The article lists the 50 richest countries by nominal GDP per capita for 2025, using IMF data, highlighting economic drivers like finance, oil, and tax havens.

Top-Ranked Countries:
  1. Luxembourg ($140,941): Leads due to its financial sector, tax haven status, and small population (~660,000).
  2. Ireland ($108,919): High ranking due to multinational tax strategies, though GNI is preferred locally to adjust for distortions.
  3. Switzerland ($104,896): Strong finance and innovation sectors.
  4. Singapore ($92,932): Financial and trade hub with favorable taxes.
  5. Iceland ($90,284): High living standards, small population.
  6. Norway ($89,694): Oil wealth and sovereign fund.
  7. United States ($89,105): Richest large-population country (>10 million), driven by diversified economy.

Energy-Rich Countries:
  • Qatar (#10, $71,653): Oil and gas wealth, small population.
  • United Arab Emirates (#23, $49,498): Oil-driven economy.
  • Saudi Arabia (#43, $30,099): Benefits from oil exports.
  • Norway (#6, $89,694): Oil wealth reinvested into $1.4T sovereign fund, stable economy.
  • Guyana (#41, $32,326): Rapid rise due to recent offshore oil discoveries.

Key Trends:
  • Tax Havens Dominate: Luxembourg, Ireland, and Singapore rank high due to low taxes attracting multinationals (e.g., Ireland’s 12.5% corporate tax rate).
  • Small Populations: Top countries often have small populations, amplifying per capita metrics.
  • Resource Wealth: Oil and gas boost rankings for Qatar, UAE, Norway, and Guyana.
  • Large Economies Lower: Germany (#19), Japan (#38), UK (#20), and France (#24) rank lower due to larger populations diluting per capita GDP.

GDP per Capita Calculated at Purchasing Power Parity (PPP)


PPP GDP per capita measures the economic well-being of countries and offers more meaningful cross-country comparisons. This is especially true when comparing developing and developed countries, where the value of the same amount of goods can vary significantly across economies.

However, 2025 PPP GDP per capita data is not yet available; according to statisticstimes.com, the latest data extends only to 2022.

Beyond Nominal GDP: Why PPP Offers a Clearer Picture of Economic Well-Being

Comparing Belgium and Taiwan’s rankings in nominal GDP per capita (2025) and PPP GDP per capita (2022) highlights the differences between these metrics and their implications for assessing economic wealth:

Belgium

  • Nominal GDP per Capita (2025): 16th ($57,772)
  • PPP GDP per Capita (2022): 21st (Int. $63,268)

Insight: Belgium ranks higher in nominal terms than in PPP, suggesting its high living costs reduce real purchasing power. Its economy, driven by trade and finance, benefits from a strong nominal GDP, but expensive domestic prices lower its PPP rank.

Taiwan

  • Nominal GDP per Capita (2025): 37th ($34,426)
  • PPP GDP per Capita (2022): 13th (Int. $69,290)

Insight: Taiwan ranks much higher in PPP than in nominal terms, indicating lower living costs amplify real purchasing power. Its tech-driven economy generates moderate nominal GDP, but affordable domestic prices significantly boost its PPP rank.


Conclusion


PPP is a more accurate indicator of actual living standards, especially for comparing countries with varying price levels, while nominal GDP better reflects global economic influence or unadjusted wealth.

Note: "Int. $" refers to International Dollars, a hypothetical currency used in Purchasing Power Parity (PPP) calculations to compare economic data across countries. It adjusts for differences in price levels and living costs, reflecting the real purchasing power of a country's income relative to a standard basket of goods and services.


References

  1. List of Countries by GDP (PPP) per capita
  2. GDP per capita, current prices
  3. These Are The 50 Richest Countries By GDP Per Capita

Saturday, June 7, 2025

David Rosenberg's 2025 Outlook: Recession Risks, Treasury Opportunities, and the Case for Bonds (May 30, 2025)

Why David Rosenberg is a "Restrained Bull" on Bonds (YouTube link)

David Rosenberg, founder of Rosenberg Research, discusses current market dynamics and economic risks with Maggie Lake, emphasizing concerns about rising U.S. Treasury yields, fiscal policy uncertainty, and a potential recession. 

Key Points

  • Rising Treasury Yields and Market Signals: 
    • The recent surge in Treasury yields is driven by a high term premium, reflecting uncertainty over trade tariffs and fiscal policy, not inflation or economic growth expectations. 
    • This rise in yields is an exogenous shock, not tied to Federal Reserve actions or a strengthening economy, and historically, bond market movements lead stock market corrections.
  • Economic Weakness and Recession Risk:
    • Rosenberg believes the economy is weaker than perceived, with softening GDP trends, declining labor demand (evident in JOLTS data), and a housing market downturn signaling broader economic slowdown.
    • The real Fed funds rate, now over 2%, is at levels seen before past recessions, supporting his view that a recession is likely by Q3 2025.
  • Fiscal and Tariff Concerns:
    • The fiscal situation, with large deficits and proposed policies like tariff hikes, is unsettling the bond market, adding a fiscal premium to yields.
    • Tariffs (effective rate now at 17%, up from 2.5%) are likely to raise consumer prices, reduce purchasing power, and contribute to demand destruction, potentially exacerbating economic weakness rather than driving sustained inflation.
  • Investment Outlook:
    • Rosenberg is bullish on U.S. Treasuries, expecting yields to fall in a recession as credit demand from households and businesses contracts, offsetting increased government borrowing. He predicts double-digit returns for 10- and 30-year Treasuries over the next 12 months.
    • He is bearish on U.S. equities, citing a high S&P 500 forward multiple (21x) and a negative equity risk premium, suggesting overvaluation. He favors non-U.S. equities (e.g., Canada, Asia, Europe) with lower valuations and stronger currencies.
    • Gold is recommended as a hedge against a weakening U.S. dollar, which he sees declining due to policy shifts and lack of Fed support.
  • Fed Policy and QE:
    • The Fed has little control over long-end yields, which are driven by market forces. Rosenberg expects the Fed to resume quantitative easing (QE) in a recession to lower rates, as seen in past downturns.
    • Current Fed policy is tight, with the real funds rate in restrictive territory, and markets are underpricing the likelihood of significant rate cuts.
  • Countering Narratives:
    • Rosenberg dismisses the idea that Treasuries are “uninvestable” due to fiscal deficits, noting that deficits typically rise in recessions, but private sector credit demand falls, supporting bond rallies.
    • He rejects the notion that the 60/40 portfolio is dead, arguing that Treasuries and equities have different risk profiles, making bonds a vital diversifier with guaranteed income and capital return.
  • Dollar and Global Context:
    • The U.S. dollar is weakening despite the Fed’s relatively tight policy, possibly due to deliberate policy shifts or loss of confidence in U.S. economic management.
    • Other regions (e.g., Europe, Japan) face their own fiscal and monetary challenges, but their lower equity valuations and rate-cutting central banks make them attractive investment destinations.


Conclusion


Rosenberg anticipates a U.S. recession by Q3 2025, driven by tight monetary policy, tariff shocks, and fiscal uncertainty. He sees Treasuries as a compelling investment due to expected yield declines and coupon protection, while advising caution on U.S. equities and favoring gold and non-U.S. markets. His outlook hinges on the economy weakening, which he believes will surprise markets and prompt Fed action.

Tuesday, June 3, 2025

McGloom's Warning: Deflation, Tariffs, and a Looming Market Correction (Jun 2, 2025)

Mike McGlone: Global Market Correction Risks (YouTube link)

In this episode of The Prospector News Podcast, recorded at the Current Trends in Mining Finance Conference in New York City, host Michael Fox interviews Mike McGlone, a senior strategist at Bloomberg Intelligence. McGlone, nicknamed "McGloom" by colleagues due to his bearish outlook, discusses concerning economic trends reminiscent of the 1930s, 1970s, and 2008, driven by historical data and ratios pointing to potential deflation and market corrections.


Key Points

  • Market Overvaluation: The U.S. stock market's capitalization-to-GDP ratio reached 2.2 last year, the highest in a century, comparable to 1929 and 1989 Japan, signaling overvaluation.
    • Buffett himself noted that a ratio above 1.0–1.2 indicates caution, and above 1.5–2.0 suggests significant overvaluation (added by author).
  • Commodity Ratios: The gold-to-silver ratio is at 100 ounces of silver per ounce of gold, near historic highs, and the gold-to-crude oil ratio indicates deflationary pressures, with crude oil demand weakening and gold rising.
  • Deflation Risks: McGlone highlights a pattern where significant inflation, fueled by massive 2020–2022 stimulus, typically leads to deflation. He cites collapsing bond yields in China and declining crude oil prices as signs of global deflationary forces.
  • Policy Challenges: The Federal Reserve is constrained from easing monetary policy due to persistent inflation (3.5–4% core measures), while fiscal stimulus is being cut, and tariffs could reduce corporate profits, further pressuring risk assets.
  • Tariffs and Trade: Unlike the multidimensional Smoot-Hawley tariffs of the 1930s, current U.S. tariffs are two-dimensional, targeting specific countries like China, Canada, and Mexico. These could disrupt global trade, particularly affecting export-heavy economies like Germany, Japan, and China, whose bond yields are significantly lower than the U.S.
  • Stock Market Risks: McGlone predicts a potential mean reversion in the S&P 500, with a fair value around 4,000 in a recession scenario, driven by tariffs, austerity, and reduced profits. He notes the market’s reliance on “buy the dip” behavior, which may falter as valuations remain unsustainable.
  • Gold as a Safe Haven: Gold is seen as a hedge against market downturns, potentially reaching $4,000 per ounce if stocks decline, as investors shift from overvalued risk assets to alternatives like gold and U.S. Treasury bonds.
  • Government Spending and Politics: Despite efforts to cut spending (e.g., DOGE initiatives), the U.S. budget deficit remains high, with military spending at record levels. McGlone suggests a stock market decline could lower yields, benefiting Trump’s voter base through cheaper mortgages and policies like no taxes on tips or overtime.
  • Historical Parallels: Comparisons to 1929, 1989 Japan, and 2008 underscore the risks of a market correction or recession, though McGlone hopes for stability but sees a “lose-lose” scenario due to high deficits, inflation, and trade disruptions.

McGlone emphasizes the need for investors to be cautious, reduce exposure to overvalued risk assets like stocks and cryptocurrencies, and consider safer assets like gold and Treasury bonds. He reflects on being early in predicting declines in crude oil and bond yields but remains confident in his deflationary outlook, citing historical patterns and current economic indicators. The podcast concludes with McGlone encouraging listeners to reach out via X (@MikeMcGlone11) or LinkedIn for further insights, stressing that the discussion is for educational purposes, not investment advice.

Oil Market at a Crossroads: Supply and Demand Decline

Global oil market at inflection point as supply, demand falls, says Paul Sankey (YouTube link)

Paul Sankey, a research president and lead analyst, discussed recent developments impacting the global oil market. 

Key Points

  • Geopolitical and Environmental Factors: An explosive attack from Ukraine on Russian oil infrastructure, combined with wildfires in Canada reducing production by 250,000 barrels per day, is contributing to market volatility. These events are significant as they coincide with OPEC's plans to increase output, which is generally bearish for oil prices.
  • Demand and Supply Shifts: The global oil market is at a critical juncture. China’s oil demand, a major driver for the past 25 years, likely peaked in 2023. Similarly, U.S. oil production, the largest globally, may have peaked geologically and is showing signs of decline. These shifts mark a transition from long-term demand and supply growth cycles (30–50 years) to potential declines.
  • OPEC and Market Dynamics: OPEC’s planned production increases are reducing its spare capacity, setting the stage for a competitive market where U.S. production efficiency will be tested. This could lead to a "market share war" if demand weakens further, potentially pushing oil prices below $50 per barrel.
  • U.S. Production Trends: U.S. oil producers are proactively cutting capital expenditure (capex) despite relatively high oil prices (above $60 per barrel), reflecting strong balance sheets and cautious management. However, declining geological productivity is outpacing efficiency gains from technology and AI, suggesting a potential 15-year decline in U.S. output, especially if prices fall to the $50s.
  • Challenges to Metrics: Traditional metrics like rig counts are less reliable due to improved efficiencies and consolidation among larger, stronger U.S. producers. The industry is moving away from smaller, high-risk players, but sustained low prices could strain smaller firms.
  • Global Implications: The peaking of Chinese demand (60–70% of global demand growth) and U.S. supply (50–70% of global supply growth) signals a major transition. The interplay between falling demand and supply, alongside OPEC’s strategy, will shape the market’s future, with risks of oversupply and price volatility.

In summary, the oil market is at an inflection point, driven by geopolitical disruptions, environmental constraints, and structural shifts in demand and supply, with U.S. production and OPEC’s moves central to the evolving landscape.