Friday, June 20, 2025

Trump’s Tariff-Driven Currency Reset: A Treasury Market Time Bomb?

Trump’s New Currency Plan Just Set Off A Treasury Time Bomb (YouTube link)


In the video above, the discussion revolves around the U.S. dollar’s role as the global reserve currency, its cyclical strength, and potential policy shifts under a Trump administration, as outlined in the GOP platform. 


Key Points


Here’re the key points:

U.S. Dollar as Global Reserve Currency:

  • The GOP platform emphasizes maintaining the U.S. dollar as the world’s reserve currency, a position explicitly supported by Trump and his proposed Treasury team.
  • Despite this, there’s an acknowledgment of trade imbalances, which are linked to the dollar’s reserve status. Addressing trade deficits while preserving the dollar’s dominance presents a complex challenge, as these are interconnected issues.

Key Figures and Policy Insights:

  • Stephen Miran is highlighted as a key economic adviser who understands the nuances of dollar policy. His work suggests that some proposed policies might initially strengthen the dollar but could lead to deliberate weakening later.
  • The distinction is made between the dollar’s cyclical strength (short-term fluctuations driven by economic conditions) and its structural role as the global reserve currency.

Dollar Policy and Trade-offs:

  • Trump has previously criticized other currencies for being "unfairly cheap," suggesting a focus on exchange rate differentials in trade negotiations. This could involve intentional dollar devaluation to address trade imbalances.
  • Policies like tariffs and trade concessions might precede a deliberate dollar weakening to boost U.S. exports, but this risks inflation due to higher import and energy prices.
  • There’s discussion of disincentivizing foreign holdings of U.S. assets (e.g., Treasuries), which artificially inflate U.S. asset values and the dollar’s exchange rate. Reducing foreign demand could weaken the dollar but disrupt markets.

Economic and Political Challenges:

  • Reversing long-standing economic trends (e.g., trade deficits and dollar strength) would create winners and losers. Sectors benefiting from a strong dollar (e.g., finance, importers) might resist, while exporters and manufacturers could gain.
  • The complexity of reversing these trends lies in the trade-offs: weakening the dollar could ease global debt burdens (especially for emerging markets with dollar-denominated debt) but risks domestic inflation and market turbulence.
  • Politicians, including Trump’s team, may downplay these downsides, promising benefits (e.g., trade balance) while minimizing costs (e.g., inflation, deficits), a common political strategy.

Global Economic Context:

  • The U.S. has benefited from a unipolar world since the Soviet Union’s collapse, fostering international cooperation but allowing trade imbalances to grow (e.g., U.S. trade deficits, Eurozone issues).
  • The world is shifting toward a multipolar system, with countries or blocs acting more independently. Trump’s team aims to mitigate policy downsides by pushing costs onto other nations, though some domestic fallout is likely.

Dollar Cycles and Historical Precedents:

  • The dollar has experienced three major cycles since the Bretton Woods system ended in 1971: strong in the 1980s (leading to the Plaza Accord), strong in the late 1990s, and strong since around 2014.
  • The current strong dollar cycle (since 2014) has been prolonged by global factors, including:
    • Weak growth in other regions (e.g., Canada’s energy policy limitations, Europe’s loss of Russian gas, China’s property bubble and tech crackdowns).
    • Investors see the U.S. as the "only game in town" due to these "own goals" by other economies.
  • The Plaza Accord (1985) is cited as a precedent for intentional dollar weakening to address trade imbalances, driven by Japan and Taiwan’s competitive exports. A similar move (e.g., a “Mar-a-Lago Accord”) could be considered to reset the current cycle.

Market Dynamics and Risks:

  • A strong dollar reduces foreign demand for U.S. debt, as seen in the past decade, with foreign central banks holding fewer Treasuries. Private-sector buying hasn’t fully offset this.
  • In 2020, a dollar spike during the COVID crash caused a Treasury market breakdown, requiring Federal Reserve intervention (QE and swap lines). This illustrates the risks of a strong dollar environment.
  • Globally, $13 trillion in dollar-denominated debt outside the U.S. creates demand for dollars, but a strong dollar strains borrowers, slows global growth, and can lead to asset sales (e.g., Treasuries), causing U.S. market volatility (e.g., 2020, 2022).

Potential Outcomes:

  • A deliberate dollar weakening could ease debt burdens for emerging markets, boost their economies, and indirectly support U.S. asset prices and growth.
  • However, this risks “sticky” inflation due to higher import and energy costs, a trade-off that may not be fully acknowledged by policymakers.
  • Post-election dollar surges (e.g., after Trump’s election) reflect expectations of lo ‘looser fiscal policy and higher inflation, potentially requiring a hawkish Fed response, which could temporarily strengthen the dollar further.

Speculative Future Moves:

  • Trump’s focus on currency differentials suggests negotiations may include currency components alongside tariffs.
  • A major cycle-ending move, like the Plaza Accord, could initiate a new 10-15-year dollar cycle, potentially stabilizing trade but requiring careful management to avoid excessive inflation or market disruption.

Conclusion

In summary, the discussion highlights the tension between maintaining the dollar’s reserve status and addressing trade imbalances. Trump’s team, led by figures like Stephen Miran, may pursue policies that initially strengthen the dollar but later involve deliberate weakening to boost exports, with risks of inflation and market pushback. Historical precedents like the Plaza Accord suggest such moves are feasible but complex, with global and domestic economic implications. The shift to a multipolar world complicates these dynamics, and policymakers may minimize the costs of these trade-offs to sell their agenda.

Tuesday, June 17, 2025

Paul Tudor Jones on Fed Chair, Trump Budget, Markets, and AI: Insights and Warnings (Jun 11, 2025)

Tudor Jones on Next Fed Chair, Trump Budget, Markets, AI (YouTube link)

Paul Tudor Jones, a prominent hedge fund manager, shared his views on various economic and investment topics during a discussion. Here's a summary of the key points:


Key Points

  • Robin Hood Foundation Competition: Jones discussed a successful fundraising event for the Robin Hood Foundation, raising $400,000, with Bill Ackman, Mark Gilbert, and Stan Druckenmiller as top performers. The competition involves a six-month long and short investment bet, and Jones hopes to expand it with more female participants.
  • Yield Curve and Fed Chair: Jones is bullish on the yield curve steepening, expecting lower front-end rates due to a new, dovish Federal Reserve chair under President Trump by mid-2026. He believes a dovish Fed is necessary to manage the U.S.'s fiscal constraints and high debt-to-GDP ratio (100%) by running negative real rates to lower interest costs.
  • U.S. Deficit and Budget: Jones expressed concerns about persistent 6%+ budget deficits, calling Trump's budget plan the "big beautiful bill." To balance the budget, he suggested drastic measures like a 6% across-the-board spending cut and significant tax hikes (e.g., 49% top income rate, 1% wealth tax, 40% capital gains rate). He believes bond markets may eventually force fiscal discipline, though the timing is uncertain.
  • Investment Strategy: Jones predicts a weaker U.S. dollar (down 10% in a year) and a steeper yield curve. For a portfolio in a debt-trap scenario, he recommends a mix of stocks, gold, and Bitcoin (1-2% allocation) to hedge inflation. He sees equities as vulnerable if bond markets react negatively to fiscal profligacy.
  • AI and Investment: Jones is enthusiastic about AI's potential to democratize quantitative modeling in finance, reducing barriers to entry for smaller firms. However, he avoids specific stock picks, focusing on AI's broader disruptive impact. He tested new AI models at his firm, noting their rapid improvement.
  • AI Risks and Regulation: Jones warned of AI's societal risks, citing Elon Musk's 20% chance of AI wiping out humanity and potential white-collar job displacement (10-20% unemployment in 1-5 years). He criticized the lack of regulatory guardrails in Trump's "big beautiful bill" and called for thoughtful discussions on AI governance to balance productivity gains with social stability.
  • Social and Economic Inequality: Jones highlighted the uneven distribution of productivity gains since the 1980s (85% to the top 10%), fueling divisiveness and distrust. He supports ideas like "Invest America" to give children investment accounts to foster capitalism's benefits and suggested taxing AI or robotics to redistribute wealth more equitably.

Conclusion


Jones advocates for fiscal caution, strategic investing around a dovish Fed, and proactive AI regulation to mitigate risks while harnessing its benefits.

Jeffrey Gundlach on U.S. Debt Crisis, Treasury Yields, and Global Investment Shifts (Jun 11, 2025)

Gundlach on Treasuries, Gold, Fed, AI, Private Credit, Trump (YouTube link)

In the video above, the speaker, Jeffrey Gundlach, focuses on the unsustainable fiscal path of the United States, highlighting concerns about rising national debt, increasing interest expenses, and shifting market dynamics that suggest a potential reckoning in financial markets. Below is a detailed summary of the key points raised:


Key Points


1. U.S. Fiscal Unsustainability and Rising Debt

  • National Debt: The U.S. is approaching a $37 trillion national debt, currently at approximately $36.95 trillion, with rapid growth. This trajectory is seen as unsustainable due to persistent budget deficits.
  • Interest Expense: The average coupon on U.S. Treasuries has risen significantly, from below 2% to around 4%. As older, low-yield bonds (e.g., 0.25% coupons issued in 2009 or 2019) mature, they are being replaced with higher-yield bonds (e.g., 4.25%), increasing the government's interest burden by 400 basis points on maturing debt. This rising cost is viewed as untenable given the size of the deficit.
  • Market Awareness: There is growing recognition in the markets that the U.S. fiscal situation is precarious, which is reflected in the behavior of long-term Treasury bonds and other financial indicators.

2. Unusual Market Behavior

  • Dollar Index Movement: Historically, during S&P 500 corrections (drops of more than 10%), the trade-weighted U.S. dollar index typically rises as investors seek safety. However, in the most recent 20% S&P 500 decline, the dollar weakened, which is an anomaly compared to the past 15 years. This suggests a shift in investor confidence in the dollar.
  • Treasury Yields and Yield Curve: Normally, when the Federal Reserve cuts interest rates, yields across the Treasury yield curve decline. However, since the Fed began cutting rates in September 2023, the 10-year Treasury yield has risen, and the yield curve is steepening. This indicates that long-term Treasuries are not behaving as traditional "flight to quality" assets.
  • Long-Term Treasuries: The long-term Treasury bond is losing its status as a safe-haven asset. It is not responding to lower interest rates or an inflation rate of around 2.5%, which may rise further. This shift is attributed to concerns about the U.S. fiscal situation and the increasing interest expense.

3. Inflation Outlook

  • Recent Data: The cumulative headline CPI (Consumer Price Index) for the latest month was 0.18%, but the rolling-off figure from a year ago was 0.1%. Over the next two months, the cumulative rise is expected to be 0.1%, suggesting that inflation may be at a near-term low but could increase.
  • Implications: Rising inflation could exacerbate the challenges of managing the national debt and interest expenses, further pressuring Treasury yields.

4. Capital Flows and Dollar Weakness

  • Net Investment Position: Over the past 15–17 years, the U.S. has seen significant foreign investment, with a net investment position growing from $3 trillion to over $25 trillion. However, the dollar is now weakening, raising concerns that some of this capital could exit the U.S.
  • Investment Strategy: The speaker suggests that dollar-based investors should consider increasing allocations to non-dollar assets, such as foreign currencies or emerging market equities, to hedge against potential capital outflows and dollar depreciation.

5. Long-Term Treasury Bonds and Quantitative Easing (QE)

  • Potential Pivot: If Treasury yields, particularly on the 30-year bond, rise to an "uncomfortably high" level (e.g., 6%), the U.S. government may face a $5 trillion budget deficit due to increased borrowing costs. This could force a policy pivot, with quantitative easing (QE) being a likely response, where the Federal Reserve would buy long-term Treasuries to suppress yields.
  • Market Opportunity: If QE is announced, long-term Treasuries could rally significantly (e.g., a 20-point price increase, equivalent to a 100 basis point drop in yield). Investors would need to act quickly to capitalize on this, ideally before the announcement, though such timing is difficult without insider information.
  • Paradigm Shift: The speaker emphasizes a "tremendous paradigm shift" where long-term Treasuries are no longer a reliable safe-haven asset, and money is not flowing into the U.S. as it once did.

6. Gold as a Safe-Haven Asset

  • Rising Demand: Gold has emerged as a new flight-to-quality asset, with retail demand surging (e.g., Costco struggling to keep gold in stock). Central banks have been accumulating gold after selling it at lower prices ($300–$400/oz) and buying it back at higher prices (around $3,000/oz).
  • Price Performance: Gold has risen from $1,800/oz to over $2,000/oz, with a 40%+ year-to-date gain, outperforming or matching assets like Bitcoin. The speaker views gold as a legitimate asset class, no longer just for "lunatic survivalists."
  • Investment Recommendation: For investors considering volatile assets like Bitcoin, the speaker suggests leveraging gold (e.g., 2x leverage) as a less risky alternative with similar upside potential.

7. Corporate Debt and Credit Markets

  • Reduced Exposure: The speaker’s firm (DoubleLine) has significantly reduced its allocation to below-investment-grade debt and leverage in its closed-end funds, with leverage at historic lows (e.g., 45% in one fund, 7% in another). This cautious approach is driven by a desire to act as a liquidity provider during market dislocations.
  • Market Valuations: The S&P 500 is described as "incredibly uninteresting" due to high valuations, with forward P/E ratios exceeding all-time highs from early 2025. Earnings estimates have been cut, yet the market remains overvalued, reminiscent of 1999 (dot-com bubble) and 2006–2007 (pre-financial crisis).
  • Credit Market Risks: The corporate debt market is showing signs of frothiness, with private credit heavily invested and potentially overvalued. The speaker draws parallels to the collateralized debt obligation (CDO) market in 2006–2007, where excessive enthusiasm preceded a crash.

8. Private Credit Concerns

  • Overinvestment: Private credit has become a popular investment, with institutions like Harvard’s $53 billion endowment facing liquidity issues, forcing them to issue bonds and consider selling private equity stakes at a discount. This suggests systemic overexposure to illiquid assets.
  • Weak Arguments: The speaker critiques the arguments for private credit:
    • Volatility: Claims that private credit is less volatile than public markets are misleading, as it can still experience significant mark-downs.
    • Historical Performance: Past outperformance is not a reliable indicator of future results, especially as public credit has recently outperformed private credit.
    • Liquidity Risks: Private credit lacks liquidity, which could lead to forced selling during a market downturn, as seen with endowments like Harvard and Stanford in 2008.
  • Potential for Forced Selling: If institutions need liquidity, they may be forced to sell private credit or equity holdings at steep discounts, creating opportunities for buyers but risks for overexposed investors.

9. Historical Context and Market Cycles

  • Long-Term Cycles: The speaker references the "Fourth Turning" concept by Neil Howe, which describes generational cycles where societies undergo major restructuring every 80–100 years. The U.S. is in such a phase, with issues like wealth inequality, calcified property relations, and disruptive technological change (e.g., AI) driving systemic challenges.
  • Wealth Inequality: The concentration of wealth and power has created a "feudal" system of lords and serfs, necessitating a restructuring of institutions, political systems, and finances.
  • Market Analogies: The current market environment is compared to the dot-com bubble (1999) and the pre-financial crisis period (2006–2007), with overhyped sectors like AI drawing parallels to electricity stocks in the early 20th century. While transformative, these sectors often see excessive enthusiasm that leads to corrections.

10. Investment Opportunities and Strategies

  • Emerging Markets: The speaker recommends selective emerging market equities, particularly in countries like India, which has demographic and economic similarities to China 35 years ago. India benefits from supply chain shifts and technological advancements, making it a long-term investment opportunity.
  • Foreign Currencies: Dollar-based investors should consider foreign currencies to diversify away from a potentially weakening dollar. The S&P 500 is underperforming compared to MSCI Europe, and emerging markets may offer currency translation benefits.
  • Waiting for Opportunities: The speaker advocates a defensive stance, holding cash and gold while waiting for a market correction. A significant credit market break (e.g., bonds dropping 30 points) could create buying opportunities, particularly in high-yield bonds, which could recover quickly.
  • Timing: The years 2027–2028 are highlighted as a potential "window of tremendous opportunity" due to an expected worsening of the Treasury problem and broader market dislocations.

11. Global vs. U.S. Problem

  • Global Issue: The fiscal and market challenges are not unique to the U.S. but are global in nature. Investors cannot fully escape by diversifying into Europe or Japan, as these regions face similar issues.
  • Long-Term Themes: Investing in assets with strong long-term growth potential, such as India or gold, is recommended as a way to navigate the global challenges.

12. Behavioral and Psychological Factors

  • Need as a Driver: The speaker emphasizes that "need" (e.g., institutions needing liquidity) is a stronger driver of investment behavior than fear or greed. Examples include endowments unable to meet capital calls in 2008 and universities seeking high returns in low-rate environments (e.g., 1993–1994).
  • Market Timing: Markets take longer to break than expected, but when they do, they decline rapidly ("stairs up, elevator down"). Investors must be patient but ready to act when opportunities arise.


Conclusion


The speaker, Jeffrey Gundlach,  paints a picture of a U.S. economy on an unsustainable fiscal path, with rising debt, increasing interest expenses, and shifting market dynamics signaling a potential crisis. Long-term Treasuries are losing their safe-haven status, the dollar is weakening, and gold is emerging as a preferred asset. Investors are advised to reduce exposure to overvalued assets like the S&P 500 and private credit, diversify into non-dollar investments, and prepare for opportunities in 2027–2028 when market dislocations could create significant buying opportunities. The broader context involves a global need for restructuring due to wealth inequality and technological disruption, with long-term investments in emerging markets like India and assets like gold recommended as hedges against these challenges.

Saturday, June 14, 2025

Revealing True Purchasing Power: Nominal vs. PPP GDP Per Capita

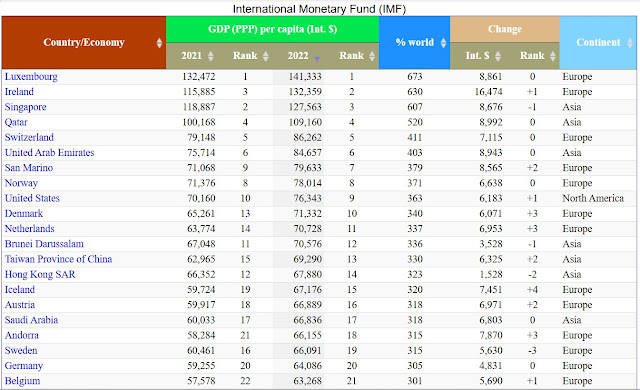
Top 21 countries ranked by PPP GDP per capita (source: StatisticsTimes.com)

GDP per Capita


Below is a summary of the ZeroHedge article "These Are The 50 Richest Countries By GDP Per Capita," published on June 13, 2025, which ranks the top 50 countries by nominal GDP per capita in 2025 based on IMF projections. All figures are in current USD, unadjusted for cost of living.

Overview: 
The article lists the 50 richest countries by nominal GDP per capita for 2025, using IMF data, highlighting economic drivers like finance, oil, and tax havens.

Top-Ranked Countries:
  1. Luxembourg ($140,941): Leads due to its financial sector, tax haven status, and small population (~660,000).
  2. Ireland ($108,919): High ranking due to multinational tax strategies, though GNI is preferred locally to adjust for distortions.
  3. Switzerland ($104,896): Strong finance and innovation sectors.
  4. Singapore ($92,932): Financial and trade hub with favorable taxes.
  5. Iceland ($90,284): High living standards, small population.
  6. Norway ($89,694): Oil wealth and sovereign fund.
  7. United States ($89,105): Richest large-population country (>10 million), driven by diversified economy.

Energy-Rich Countries:
  • Qatar (#10, $71,653): Oil and gas wealth, small population.
  • United Arab Emirates (#23, $49,498): Oil-driven economy.
  • Saudi Arabia (#43, $30,099): Benefits from oil exports.
  • Norway (#6, $89,694): Oil wealth reinvested into $1.4T sovereign fund, stable economy.
  • Guyana (#41, $32,326): Rapid rise due to recent offshore oil discoveries.

Key Trends:
  • Tax Havens Dominate: Luxembourg, Ireland, and Singapore rank high due to low taxes attracting multinationals (e.g., Ireland’s 12.5% corporate tax rate).
  • Small Populations: Top countries often have small populations, amplifying per capita metrics.
  • Resource Wealth: Oil and gas boost rankings for Qatar, UAE, Norway, and Guyana.
  • Large Economies Lower: Germany (#19), Japan (#38), UK (#20), and France (#24) rank lower due to larger populations diluting per capita GDP.

GDP per Capita Calculated at Purchasing Power Parity (PPP)


PPP GDP per capita measures the economic well-being of countries and offers more meaningful cross-country comparisons. This is especially true when comparing developing and developed countries, where the value of the same amount of goods can vary significantly across economies.

However, 2025 PPP GDP per capita data is not yet available; according to statisticstimes.com, the latest data extends only to 2022.

Beyond Nominal GDP: Why PPP Offers a Clearer Picture of Economic Well-Being

Comparing Belgium and Taiwan’s rankings in nominal GDP per capita (2025) and PPP GDP per capita (2022) highlights the differences between these metrics and their implications for assessing economic wealth:

Belgium

  • Nominal GDP per Capita (2025): 16th ($57,772)
  • PPP GDP per Capita (2022): 21st (Int. $63,268)

Insight: Belgium ranks higher in nominal terms than in PPP, suggesting its high living costs reduce real purchasing power. Its economy, driven by trade and finance, benefits from a strong nominal GDP, but expensive domestic prices lower its PPP rank.

Taiwan

  • Nominal GDP per Capita (2025): 37th ($34,426)
  • PPP GDP per Capita (2022): 13th (Int. $69,290)

Insight: Taiwan ranks much higher in PPP than in nominal terms, indicating lower living costs amplify real purchasing power. Its tech-driven economy generates moderate nominal GDP, but affordable domestic prices significantly boost its PPP rank.


Conclusion


PPP is a more accurate indicator of actual living standards, especially for comparing countries with varying price levels, while nominal GDP better reflects global economic influence or unadjusted wealth.

Note: "Int. $" refers to International Dollars, a hypothetical currency used in Purchasing Power Parity (PPP) calculations to compare economic data across countries. It adjusts for differences in price levels and living costs, reflecting the real purchasing power of a country's income relative to a standard basket of goods and services.


References

  1. List of Countries by GDP (PPP) per capita
  2. GDP per capita, current prices
  3. These Are The 50 Richest Countries By GDP Per Capita

Saturday, June 7, 2025

David Rosenberg's 2025 Outlook: Recession Risks, Treasury Opportunities, and the Case for Bonds (May 30, 2025)

Why David Rosenberg is a "Restrained Bull" on Bonds (YouTube link)

David Rosenberg, founder of Rosenberg Research, discusses current market dynamics and economic risks with Maggie Lake, emphasizing concerns about rising U.S. Treasury yields, fiscal policy uncertainty, and a potential recession. 

Key Points

  • Rising Treasury Yields and Market Signals: 
    • The recent surge in Treasury yields is driven by a high term premium, reflecting uncertainty over trade tariffs and fiscal policy, not inflation or economic growth expectations. 
    • This rise in yields is an exogenous shock, not tied to Federal Reserve actions or a strengthening economy, and historically, bond market movements lead stock market corrections.
  • Economic Weakness and Recession Risk:
    • Rosenberg believes the economy is weaker than perceived, with softening GDP trends, declining labor demand (evident in JOLTS data), and a housing market downturn signaling broader economic slowdown.
    • The real Fed funds rate, now over 2%, is at levels seen before past recessions, supporting his view that a recession is likely by Q3 2025.
  • Fiscal and Tariff Concerns:
    • The fiscal situation, with large deficits and proposed policies like tariff hikes, is unsettling the bond market, adding a fiscal premium to yields.
    • Tariffs (effective rate now at 17%, up from 2.5%) are likely to raise consumer prices, reduce purchasing power, and contribute to demand destruction, potentially exacerbating economic weakness rather than driving sustained inflation.
  • Investment Outlook:
    • Rosenberg is bullish on U.S. Treasuries, expecting yields to fall in a recession as credit demand from households and businesses contracts, offsetting increased government borrowing. He predicts double-digit returns for 10- and 30-year Treasuries over the next 12 months.
    • He is bearish on U.S. equities, citing a high S&P 500 forward multiple (21x) and a negative equity risk premium, suggesting overvaluation. He favors non-U.S. equities (e.g., Canada, Asia, Europe) with lower valuations and stronger currencies.
    • Gold is recommended as a hedge against a weakening U.S. dollar, which he sees declining due to policy shifts and lack of Fed support.
  • Fed Policy and QE:
    • The Fed has little control over long-end yields, which are driven by market forces. Rosenberg expects the Fed to resume quantitative easing (QE) in a recession to lower rates, as seen in past downturns.
    • Current Fed policy is tight, with the real funds rate in restrictive territory, and markets are underpricing the likelihood of significant rate cuts.
  • Countering Narratives:
    • Rosenberg dismisses the idea that Treasuries are “uninvestable” due to fiscal deficits, noting that deficits typically rise in recessions, but private sector credit demand falls, supporting bond rallies.
    • He rejects the notion that the 60/40 portfolio is dead, arguing that Treasuries and equities have different risk profiles, making bonds a vital diversifier with guaranteed income and capital return.
  • Dollar and Global Context:
    • The U.S. dollar is weakening despite the Fed’s relatively tight policy, possibly due to deliberate policy shifts or loss of confidence in U.S. economic management.
    • Other regions (e.g., Europe, Japan) face their own fiscal and monetary challenges, but their lower equity valuations and rate-cutting central banks make them attractive investment destinations.


Conclusion


Rosenberg anticipates a U.S. recession by Q3 2025, driven by tight monetary policy, tariff shocks, and fiscal uncertainty. He sees Treasuries as a compelling investment due to expected yield declines and coupon protection, while advising caution on U.S. equities and favoring gold and non-U.S. markets. His outlook hinges on the economy weakening, which he believes will surprise markets and prompt Fed action.

Tuesday, June 3, 2025

McGloom's Warning: Deflation, Tariffs, and a Looming Market Correction (Jun 2, 2025)

Mike McGlone: Global Market Correction Risks (YouTube link)

In this episode of The Prospector News Podcast, recorded at the Current Trends in Mining Finance Conference in New York City, host Michael Fox interviews Mike McGlone, a senior strategist at Bloomberg Intelligence. McGlone, nicknamed "McGloom" by colleagues due to his bearish outlook, discusses concerning economic trends reminiscent of the 1930s, 1970s, and 2008, driven by historical data and ratios pointing to potential deflation and market corrections.


Key Points

  • Market Overvaluation: The U.S. stock market's capitalization-to-GDP ratio reached 2.2 last year, the highest in a century, comparable to 1929 and 1989 Japan, signaling overvaluation.
    • Buffett himself noted that a ratio above 1.0–1.2 indicates caution, and above 1.5–2.0 suggests significant overvaluation (added by author).
  • Commodity Ratios: The gold-to-silver ratio is at 100 ounces of silver per ounce of gold, near historic highs, and the gold-to-crude oil ratio indicates deflationary pressures, with crude oil demand weakening and gold rising.
  • Deflation Risks: McGlone highlights a pattern where significant inflation, fueled by massive 2020–2022 stimulus, typically leads to deflation. He cites collapsing bond yields in China and declining crude oil prices as signs of global deflationary forces.
  • Policy Challenges: The Federal Reserve is constrained from easing monetary policy due to persistent inflation (3.5–4% core measures), while fiscal stimulus is being cut, and tariffs could reduce corporate profits, further pressuring risk assets.
  • Tariffs and Trade: Unlike the multidimensional Smoot-Hawley tariffs of the 1930s, current U.S. tariffs are two-dimensional, targeting specific countries like China, Canada, and Mexico. These could disrupt global trade, particularly affecting export-heavy economies like Germany, Japan, and China, whose bond yields are significantly lower than the U.S.
  • Stock Market Risks: McGlone predicts a potential mean reversion in the S&P 500, with a fair value around 4,000 in a recession scenario, driven by tariffs, austerity, and reduced profits. He notes the market’s reliance on “buy the dip” behavior, which may falter as valuations remain unsustainable.
  • Gold as a Safe Haven: Gold is seen as a hedge against market downturns, potentially reaching $4,000 per ounce if stocks decline, as investors shift from overvalued risk assets to alternatives like gold and U.S. Treasury bonds.
  • Government Spending and Politics: Despite efforts to cut spending (e.g., DOGE initiatives), the U.S. budget deficit remains high, with military spending at record levels. McGlone suggests a stock market decline could lower yields, benefiting Trump’s voter base through cheaper mortgages and policies like no taxes on tips or overtime.
  • Historical Parallels: Comparisons to 1929, 1989 Japan, and 2008 underscore the risks of a market correction or recession, though McGlone hopes for stability but sees a “lose-lose” scenario due to high deficits, inflation, and trade disruptions.

McGlone emphasizes the need for investors to be cautious, reduce exposure to overvalued risk assets like stocks and cryptocurrencies, and consider safer assets like gold and Treasury bonds. He reflects on being early in predicting declines in crude oil and bond yields but remains confident in his deflationary outlook, citing historical patterns and current economic indicators. The podcast concludes with McGlone encouraging listeners to reach out via X (@MikeMcGlone11) or LinkedIn for further insights, stressing that the discussion is for educational purposes, not investment advice.

Oil Market at a Crossroads: Supply and Demand Decline

Global oil market at inflection point as supply, demand falls, says Paul Sankey (YouTube link)

Paul Sankey, a research president and lead analyst, discussed recent developments impacting the global oil market. 

Key Points

  • Geopolitical and Environmental Factors: An explosive attack from Ukraine on Russian oil infrastructure, combined with wildfires in Canada reducing production by 250,000 barrels per day, is contributing to market volatility. These events are significant as they coincide with OPEC's plans to increase output, which is generally bearish for oil prices.
  • Demand and Supply Shifts: The global oil market is at a critical juncture. China’s oil demand, a major driver for the past 25 years, likely peaked in 2023. Similarly, U.S. oil production, the largest globally, may have peaked geologically and is showing signs of decline. These shifts mark a transition from long-term demand and supply growth cycles (30–50 years) to potential declines.
  • OPEC and Market Dynamics: OPEC’s planned production increases are reducing its spare capacity, setting the stage for a competitive market where U.S. production efficiency will be tested. This could lead to a "market share war" if demand weakens further, potentially pushing oil prices below $50 per barrel.
  • U.S. Production Trends: U.S. oil producers are proactively cutting capital expenditure (capex) despite relatively high oil prices (above $60 per barrel), reflecting strong balance sheets and cautious management. However, declining geological productivity is outpacing efficiency gains from technology and AI, suggesting a potential 15-year decline in U.S. output, especially if prices fall to the $50s.
  • Challenges to Metrics: Traditional metrics like rig counts are less reliable due to improved efficiencies and consolidation among larger, stronger U.S. producers. The industry is moving away from smaller, high-risk players, but sustained low prices could strain smaller firms.
  • Global Implications: The peaking of Chinese demand (60–70% of global demand growth) and U.S. supply (50–70% of global supply growth) signals a major transition. The interplay between falling demand and supply, alongside OPEC’s strategy, will shape the market’s future, with risks of oversupply and price volatility.

In summary, the oil market is at an inflection point, driven by geopolitical disruptions, environmental constraints, and structural shifts in demand and supply, with U.S. production and OPEC’s moves central to the evolving landscape.


Sunday, May 25, 2025

Outlook for 2025: Tom McClellan's Market Analysis on Thoughtful Money (May 25, 2025)

Current Bear Market Rally To Bring "More Pain This Year" | Tom McClellan (YouTube link)

In this episode of "Thoughtful Money", host Adam Taggart invites technical analyst Tom McClellan to dissect Wall Street's recent volatility. They explore whether the March-April dip was a minor setback or if the subsequent May rebound signals a deceptive bear market rally. With conflicting economic indicators and the potential for a more significant downturn in 2025, McClellan offers his expert analysis and insights to guide investors through the uncertain financial landscape.

Bear Market Expectation

  • Outlook for 2025: Tom McClellan predicts 2025 will be a bearish year for stocks, based on a 10-year leading indicator from crude oil prices, which dropped significantly in 2014, suggesting a stock market decline starting in 2024 and continuing through 2025, with a potential bottom in January 2026.
  • Recent Rally: The strong market breadth (advance-decline line surge) and a Zweig Breadth Thrust signal post-April 8, 2025, low suggest a bullish liquidity surge. However, McClellan believes this is likely a bear market rally, not a return to a bull market, due to historical patterns and the crude oil indicator.


Key Points

Key Technical Indicators

  • Advance-Decline Line: A bearish divergence in late 2024/early 2025 (higher S&P 500, lower advance-decline line) signaled liquidity issues, but recent strength (new high in advance-decline line) contradicts the bearish outlook, creating an interpretational conflict.
  • Zweig Breadth Thrust: A rare signal of strong market breadth occurred after the April low, historically bullish since 1950, but exceptions (e.g., 2004, 2015, 2023) show lower lows can follow, suggesting this rally could be a trap.
  • Corporate High Yield Bonds: Unlike the NYSE advance-decline line, the high yield bond advance-decline line hasn’t confirmed the rally, indicating potential liquidity constraints.
  • M2/GDP Ratio: A declining M2/GDP ratio since 2020 suggests a “payback” period of market weakness, likely starting now and peaking around July-October 2025, with a one-year lag effect.
  • Reverse Repos: Inverted reverse repo data (from the St. Louis Fed) shows liquidity trends, with recent increases suggesting stock price declines in the near term, as markets overshot due to emotional exuberance (low put-call ratio).

Macro and Seasonal Factors

  • Political Chaos: The new administration’s unpredictability (e.g., tariff announcements) contributes to market volatility, likened to an “800lb gorilla” causing “sloshing” in liquidity.
  • Seasonal Weakness: Historical July-August weakness aligns with potential declines, partly explained by psychological effects of shrinking daylight in autumn, impacting investor risk aversion.
  • Bond Yields and Gold: Rising gold prices (above $3,300/oz) signal higher long-term bond yields starting late June 2025, potentially diverting capital from stocks. A brief yield drop in June could offer a refinancing opportunity.

Investment Strategy

  • Cautious Approach: McClellan advises against buy-and-hold for 2025, recommending “T-bill and chill” to preserve capital. Investors should wait for a better entry in 2026-2028.
  • Sector Focus: Grains (corn, wheat, rapeseed) and related stocks (e.g., fertilizer like Nutrien, or John Deere) are favored due to gold’s 12-month leading indicator for grain prices.
  • Gold Outlook: Gold may correct short-term (midpoint of a 13.5-month cycle, bottoming in ~6 months), but long-term bullishness depends on central bank buying (e.g., China, India).
  • Bonds: Avoid long-duration bonds post-June 2025 due to rising yields; June may offer a trading opportunity in bonds (e.g., TLT) or refinancing.

Parting Advice

Retail investors should prioritize capital preservation in 2025, avoiding major losses in a potentially stormy market. Active traders can explore grains or related sectors, but patience for a 2026 uptrend is key.

For more, visit McClellan’s website (mcoscillator.com) for newsletters and free resources, or check thoughtfulmoney.com for financial advisory consultations.

Navigating Crisis: Oil Markets, U.S. Policy Shifts, and the Rise of Bitcoin in a Multipolar World (May 2025)

Expert REVEALS Trumps Plan for the Middle East & Why Oil Price is about to EXPLODE (YouTube link)

Summary of the Podcast Episode

The podcast episode was from TFTC (Truth for the Commoner), a Bitcoin-focused media platform, featuring a discussion with Anas Alhajji, an energy market expert. The conversation, recorded on May 24, 2025, covers oil markets, U.S. foreign policy in the Middle East, the dollar's global role, and energy sector challenges, with brief mentions of Bitcoin's role in the geopolitical and economic landscape.


Key Points


Oil Market Dynamics:

  • Current Prices: WTI crude is trading at $62.50, down 20% over the past year, despite market fundamentals supporting higher prices (in the $70s). The drop is attributed to China's economic slowdown and global uncertainty caused by U.S. trade policies under Trump.
  • China's Role: China's economic stall since early 2024 has significantly impacted global oil demand. Real growth in China is estimated at 2.5–3%, far below the government's claimed 5%, and a recovery above 5% is needed to push oil prices back to the $80s.
  • Trump's Trade Policies: The Trump administration's erratic tariff policies (e.g., 145% tariffs, 90-day delays) create confusion, stalling investments and economic growth (see also [1]). Unintended consequences include front-loading imports (e.g., Apple's iPhone shipments) and distorted trade data, contributing to fears of a recession.
  • Recession Risks: A potential 2025 recession could lead to a massive inventory build, depressing oil demand in 2026 and keeping prices low unless OPEC+ cuts production.

U.S. Foreign Policy in the Middle East:

  • Syria and Regional Shifts: Trump’s recognition of Syria’s new government marks a significant policy shift, aiming to counter Iran and Russia’s influence. Syria’s strategic location offers opportunities for U.S. companies to rebuild its infrastructure, with contracts like the UAE’s deal to revamp Syrian ports.
  • Criticism of Nation-Building: Trump’s speech emphasized a departure from nation-building (e.g., Afghanistan, Iraq), criticizing past U.S. policies under George W. Bush and Clinton-era Democrats. He advocates for leaving nations to prosper independently, focusing on trade over military intervention.
  • Investment Focus: Trump’s Middle East trip was primarily about investment (e.g., AI, energy, weapons deals with Saudi Arabia, UAE, Turkey), aiming to strengthen U.S. economic ties and counter China and Russia. Deals with Boeing and others pulled business away from China and Europe, extending Trump’s trade war strategy.
  • Iran Nuclear Program: The U.S. views Iran’s nuclear program (even peaceful) as a stabilizing force for a regime it opposes, creating a “never-ending crisis.” Iran seeks domestic stability through nuclear energy to boost oil exports, but mistrust over uranium enrichment stalls negotiations. Iran is likely delaying talks until it can develop a nuclear bomb, believing it will shift regional dynamics.

Dollar and BRICS:

  • BRICS as a Paper Tiger: The podcast dismisses the idea of BRICS (Brazil, Russia, India, China, South Africa) challenging the dollar, calling it a “paper tiger.” BRICS’ cohesion is undermined by conflicts like India-Pakistan tensions, and its influence is largely driven by China alone.
  • Dollar Dominance: The dollar and petrodollar are seen as secure, with no viable alternative currency emerging (see also [2]). Europe took centuries to unify for the euro, making a BRICS currency unfeasible in the near term.

Energy Sector Challenges:

  • U.S. Oil Production: Trump’s goal to boost U.S. oil production (e.g., by 3 million barrels/day as in his first term) is unrealistic. Shale production faces high decline rates, requiring 600,000+ barrels/day of new oil monthly just to stay flat. High interest rates and a shift from “drill baby drill” to “control baby control” by majors further limit growth.
  • Energy Demand Surge: Global energy demand is rising due to urbanization, migration, AI, and data centers. Migrants’ energy consumption increases dramatically (e.g., 70x for Afghans moving to the U.S.), and AI/data center growth outpaces renewable energy expansion, ensuring continued reliance on oil, gas, and coal.
  • Infrastructure Issues: Aging grids and insufficient manufacturing capacity for natural gas turbines threaten energy reliability. Blackouts are increasingly common (e.g., California, Texas, Kuwait), and renewables like wind are unreliable without backup.
  • Trump’s Stance on Oil: Despite perceptions, Trump historically dislikes the oil industry, blaming it for past business failures (e.g., Trump Airlines bankruptcy). His Gulf visit is framed as extracting oil money due to disdain, not support.

Bitcoin and AI:

  • Bitcoin’s Role: The podcast briefly touches on Bitcoin, noting its market cap growth from $200 billion to $2 trillion over four years. Geopolitical uncertainty, sanctions, and potential money printing could drive Bitcoin demand, though its market is now more liquid for energy deals.
  • AI and Energy: AI’s energy demands exacerbate grid strain, risking public backlash if data centers are prioritized over residential power. Bitcoin mining’s flexibility (e.g., selling power during shortages) is contrasted with AI’s rigidity, suggesting paired operations to balance grid demands.

Policy Recommendations:

  • Align Time Horizons: Energy projects span decades, while political cycles are short (2–8 years). Policymakers must avoid flip-flopping policies (e.g., Biden’s climate push vs. Trump’s rollbacks) to reduce confusion and encourage long-term investment.
  • Data Integrity: The Department of Energy’s capacity has deteriorated under Trump’s DOGE initiative, with staff cuts leading to canceled reports (e.g., International Energy Outlook). The EIA’s data quality has declined, forcing reliance on private firms for credible analysis.
  • Bullish Sectors: The speaker is bullish on LNG (a growing global market) and the power sector (driven by AI and utilities), but cautious on U.S. natural gas and oil due to structural constraints.

Critical Insights:

  • The podcast highlights systemic fragility in energy markets, exacerbated by policy inconsistency and geopolitical tensions. Trump’s trade war tactics, while strategically aimed at countering China, create economic uncertainty that could trigger a recession, further depressing oil prices.
  • The shift in U.S. Middle East policy toward trade and investment, rather than military intervention, aligns with Trump’s “peace through trade” approach but faces challenges in execution (e.g., tariff confusion, Iran stalemate).
  • Bitcoin’s growing liquidity positions it as a potential hedge in a multipolar world, though its energy-intensive nature ties it to broader grid challenges.


Conclusion

The episode paints a complex picture of global energy markets and geopolitics in May 2025, with oil prices suppressed by China’s slowdown and Trump’s unpredictable policies, despite fundamentals suggesting higher prices. U.S. Middle East diplomacy focuses on investment and countering China/Russia, but domestic energy challenges (e.g., grid reliability, shale constraints) and data deterioration hinder progress. Bitcoin and AI emerge as key players in the energy landscape, with LNG and utilities as bright spots for future growth. Aligning political and energy project timelines is critical to resolving these issues.


See Also

  1. Trump’s New Tariff Threats Show Trade Uncertainty Here to Stay (Bloomberg)
  2. Prague Finance Institute with Lyn Alden, Author of Broken Money

Saturday, May 24, 2025

Doug Casey's International Man: A Dying Man Will Try Any Medicine

Image Credit: Grok 3

Doug Casey’s International Man Communiqué is a free, email-based newsletter offering contrarian insights and strategies for international diversification, targeting freedom seekers and investors. It combines geopolitical analysis, investment speculation, and practical advice on offshore strategies, rooted in Casey’s libertarian philosophy. 

On May 23, 2025, A Dying Man Will Try Any Medicine, written by Chris MacIntosh, was distributed.


Overview: 


Here is a summary of A Dying Man Will Try Any Medicine by Chris MacIntosh:

The article by Chris MacIntosh discusses the current state of global trade, politics, and the financial system, focusing on U.S. tariffs, the decline of the dollar-based financial order, and the rise of alternative systems like China's CIPS and Bitcoin. It frames these developments within historical monetary cycles, geopolitical tensions, and technological disruptions, warning of potential economic and social consequences.


Key Points:

  • Global Trade and Tariffs:
    • Recent U.S. tariffs, described as "reciprocal" by former President Trump, are not based on fairness but on trade surpluses of other countries with the U.S. MacIntosh argues they aim to restructure global creditors, akin to bankruptcy proceedings, targeting nations like China to slow their economic rise.
    • The tariffs reflect a U.S. attempt to preserve its financial dominance as the dollar-based system weakens, with fears of China’s growing influence through its industrial base and digital yuan.
  • Four Historical Forces:
    • Monetary and Credit Cycle: Sovereign debt crises drive restructuring, as seen in the U.S.’s fragile Treasury bond and stock markets.
    • Domestic Conflict: Political polarization hinders resolution through discourse, increasing instability.
    • International Conflict: Rising powers like China challenge the U.S.-led order, threatening the dollar’s dominance.
    • Technological Changes: Innovations like China’s CIPS (surpassing SWIFT in transaction volume on April 16, 2025) and cryptocurrencies disrupt traditional finance.
  • U.S.-China Trade War:
    • The trade war is less about "fair trade" and more about the U.S. protecting its monetary dominance. China’s financial systems (e.g., CIPS, digital yuan) threaten the U.S.-led SWIFT and dollar-based order.
    • U.S. concerns include China’s ability to undermine the dollar’s role as the global reserve currency, with tariffs as a tool to delay this shift.
  • U.S. Financial Fragility:
    • The U.S. Treasury bond market and stock market are vulnerable, with fears of foreign nations (e.g., China, Japan) selling Treasuries, prompting punitive tariffs.
    • The U.S.’s $7.5 trillion budget and borrowing needs (over 10% of GDP annually) highlight unsustainable debt levels, with efforts like DOGE (cutting $50 billion) being insufficient.
  • Bitcoin and Gold:
    • Bitcoin stocks are poised for significant gains, with MacIntosh promoting a report on a top Bitcoin stock pick, citing potential 32x or 75x returns due to Bitcoin’s growing adoption.
    • Gold is in a bull market, though short-term pullbacks are possible. MacIntosh advises against selling in a bull market or buying in a bear market (like bonds).
  • Implications:
    • The U.S. is depicted as a "dying empire" trying to maintain financial control, while China’s rise signals a shift toward a multipolar financial order (see also [1]).
    • The article warns of systemic risks, including potential social unrest due to economic imbalances and loss of confidence in the U.S. financial system (see also [2]).

See Also:

  1. Prague Finance Institute with Lyn Alden, Author of Broken Money
  2. Decoding the Fourth Turning: Why War, Debt, and Social Unrest Loom

Susquehanna's Chris Murphy on Meme Stock Frenzy: Short-Term Trades Dominate Amid Volatility Shifts

Susquehanna's Chris Murphy on trading meme stocks: Remain very short term to avoid volatility (YouTube link)

On May 14, 2024, CNBC's The Exchange featured Chris Murphy from Susquehanna International Group, who discussed the "meme stock" spike and other stocks experiencing increased volatility at the time.

Here is a summary of the interview with Chris Murphy, Co-Head of Derivative Strategy at Susquehanna.


Key Points Include:

  • Options Trading Activity:
    • There’s significant buying of call options on certain stocks, with trade sizes indicating a mix of retail and institutional (hedge fund) participation. Small trades (1-5 options) suggest retail, while large blocks (2,500-5,000) point to institutional involvement.
  • Comparison to Past Episodes:
    • Unlike the 2021 meme stock frenzy, current activity is less intense. Short sellers are more cautious, having learned from 2021, and are not as aggressively short, reducing the likelihood of a massive short squeeze.
  • Short Squeeze vs. Fundamentals:
    • The trading is primarily driven by short-term momentum and short squeezes, not long-term fundamentals. Stocks like GME (24% short interest) and AMC (21%) are targeted due to high short interest, with traders chasing the next heavily shorted name. While strong fundamentals can support trades, the focus is on intraday momentum, not long-term investments.
  • Identifying Next Candidates:
    • Potential targets for this momentum-driven trading include stocks with spikes in call option volume and volatility, such as SPCE and ROKU (noted for decent short interest). Declining volatility in current names signals the momentum trade moving to new stocks.
  • Broader Market Outlook:
    • The market is at all-time highs, with investors awaiting CPI data to confirm if recent inflation upticks are temporary. S&P 500 options are currently inexpensive, suggesting a low-volatility environment. Murphy is cautiously optimistic, predicting the market may rise over the next six months, with options offering a way to gain exposure while hedging against downside risks.

Key Takeaway: 

The options trading surge is a mix of retail and institutional activity, driven by short-term momentum and short squeezes rather than fundamentals. Traders are targeting high short-interest stocks, with potential next candidates like SPCE and ROKU. In the broader market, low-cost S&P 500 options provide opportunities for bullish bets with downside protection, pending CPI clarity.


See Also:

  1. Understanding Options Contracts

Friday, May 23, 2025

Prague Finance Institute with Lyn Alden, Author of Broken Money

Lyn Alden: "For the first time in modern history, life expectancy in the US is not increasing." (YouTube link)

The conversation unfolded with Andre Chelhot, CFA, Chief Economist at PFI, at the helm. He guided the discussion alongside his esteemed guest, Lyn Alden. Alden, a renowned investor, best-selling author, and global speaker, brought her unique insights to the table, particularly focusing on the fascinating intersection of money and technology.  

Key points include:

1. Evolution of the Global Monetary System:

  • Bretton Woods and Nixon Shock: Post-World War II, the U.S. dollar became the world’s primary ledger, pegged to gold under the Bretton Woods system. However, the lack of constraints on dollar creation led to an imbalance, with U.S. gold reserves depleting by the 1960s. In 1971, Nixon ended gold convertibility, resulting in a fiat-based system with no scarce backing.
  • Post-1971 System: The dollar retained dominance due to its liquidity, global acceptability, and the U.S.-Saudi petrodollar agreement (pricing oil in dollars, storing reserves in treasuries). The U.S. supplied dollars via trade deficits, creating imbalances that overvalued U.S. import power and reduced manufacturing competitiveness.
  • Geopolitical Fragmentation: The current system shows signs of cracking, with potential shifts toward a multipolar world where currencies like the Chinese yuan and euro gain prominence, possibly alongside neutral assets like gold or Bitcoin.

2. Potential Mar-a-Lago Accord and Capital Flows:

  • Plaza Accord Comparison: The 1985 Plaza Accord weakened the dollar to boost U.S. competitiveness without altering the monetary order. A potential Mar-a-Lago Accord could similarly weaken the dollar cyclically to address trade imbalances but wouldn’t fundamentally change the dollar-centric system.
  • Impact on Capital Flows: In a fragmented system, debtor regions (e.g., emerging markets) may face higher capital costs, while creditor regions (e.g., China) could offer lower rates. China could redenominate dollar-based debts into yuan during shortages, easing transitions but facing network effect frictions.

3. China and Semiconductors in Yuan:

  • China, a rising exporter of complex goods (e.g., cars), could price semiconductors in yuan, leveraging its position as the largest trading partner for most countries. However, limited capital market depth and restricted capital flows hinder the yuan’s global adoption compared to the dollar.

4. Bitcoin as a Monetary Anchor:

  • Potential and Challenges: Bitcoin could serve as a decentralized, scarce ledger with fast settlement, unlike gold, which is slow to transfer and audit. Its network effect as the leading cryptocurrency supports its growth, but volatility, small market size, and career risks for central bankers limit adoption.
  • Criticisms Addressed:
    • Fractional Reserve Banking: Bitcoin wouldn’t support long-term fractional reserve banking, favoring shorter-term, productive debt over inflationary, permanent debt.
    • Banning Risk: Banning Bitcoin is difficult due to its decentralized nature and global gray markets. Political incentives (e.g., donor support) and polarization reduce ban likelihood in places like the U.S.
    • Volatility: Bitcoin’s volatility reflects its growth phase as an emerging store of value. As its market cap grows (e.g., to $5–10 trillion), liquidity and stability should increase.

5. Governments and Money Control:

  • Governments rely on money control to influence societies, but Bitcoin’s decentralized nature challenges this. Historical examples (e.g., dollar adoption in failing emerging markets) suggest that destabilized currencies could lead to Bitcoin’s rise, though major economies have significant resources to defend their currencies.

6. Reserve Currency Prospects:

  • Conditions for Reserve Status: Deep financial markets and rule of law are critical. The U.S. dollar benefits from both, though its rule of law is fraying (e.g., freezing Russian reserves). The euro faces fragmented capital markets, and China’s yuan is limited by capital controls and weaker rule of law.
  • Outlook: A multipolar system is emerging slowly, with the yuan and euro gaining ground, but smaller currencies (e.g., ruble, Brazilian real) lack global scalability. Neutral assets like gold and Bitcoin could reduce reliance on any single currency.

7. Triffin Dilemma and Trade Deficits:

  • The U.S.’s trade deficits, necessary to supply global dollar demand, create imbalances unsustainable as its GDP share shrinks (25% nominally, 15% PPP). A multipolar system with regional currencies (e.g., euro for Europe, yuan for Asia) and neutral assets could mitigate these imbalances.

8. Government Debt Repayment:

  • Governments, especially those with major currencies, rarely default nominally but inflate debt away, eroding purchasing power. Recent negative-yielding bonds ($18 trillion in 2019) and low yields relative to money supply growth exemplify this. Financial repression (e.g., mandating banks to hold treasuries) is likely, though unpopular.

9. Asset Inflation and Social Unrest:

  • Negative yields and inflation have driven asset price surges, exacerbating inequality. High borrowing costs for individuals and small businesses contrast with low government rates, fueling financial repression.
  • Social Unrest Risks: Persistent inequality, high rates, and potential triggers (e.g., Social Security trust fund depletion by the mid-2030s, energy shortages, AI disruptions) could lead to unrest, populism, and polarization, especially in the West. Public frustration may grow as systemic issues become apparent, with disagreements over causes potentially leading to extreme outcomes.

Conclusion: 

Lyn Alden highlights a transitioning global monetary system, with the dollar’s dominance weakening but no immediate replacement. Bitcoin and neutral assets like gold offer alternatives, but entrenched network effects and government control pose challenges. Inflation, financial repression, and rising inequality could drive social unrest, particularly in the late 2020s to 2030s, as structural imbalances force tough policy choices.

Thursday, May 22, 2025

10-Year Yields: The Rate of Ascent, Not Just the Level, Threatens Stocks

One of the headlines on ZeroHedge.com states:

Below is an analysis of the statement and its implications.

The statement highlights a critical dynamic:

Rapid increases in 10-year bond yields pose a greater threat to stock markets than the absolute yield level. 

Historical episodes (e.g., 1994, 2013, 2018) suggest that a 50–100 basis point rise over a few months can trigger equity corrections, particularly in high-valuation or rate-sensitive sectors. In the context of May 2025, a surge in U.S. 10-year yields (potentially to 5–5.5%) could pressure stocks, especially if driven by global factors like Japan’s bond market dynamics and/or reduced foreign demand for Treasuries.

Japan’s 30-Year and 40-Year Bonds Crater, Yields Spike (Source: WOLFSTREET.com)


Japan’s 40-Year Bond Yield Surge

In this article and other X posts (e.g., @onechancefreedm), multiple sources have discussed the recent surge in Japan’s 40-year government bond yield to an all-time high of 3.63% and its broader implications for global financial markets. Here is the summary of key points:

  • The yield on Japan’s 40-year government bonds has reached 3.63%, an all-time high.
  • This is significant because Japan, with a debt-to-GDP ratio above 260%, has historically relied on financial repression (artificially low interest rates) to manage its massive debt load.
  • The rise in yields signals a potential loss of investor confidence in Japan’s ability to sustain low borrowing costs over the long term, challenging the Bank of Japan’s (BoJ) Yield Curve Control (YCC) policy.

Japan’s YCC policy, which caps 10-year bond yields near zero, has been a cornerstone of its strategy to keep borrowing costs low.  The surge in 40-year yields suggests that investors are demanding higher returns to lend to Japan for extended periods, indicating a crack in the BoJ’s control over long-term yields.

The Bond Market Has Lost Patience, Principal’s Shah Says (YouTube link)

Loss of Central Bank Credibility


Some X posts frame the yield spike as a “structural alarm bell,” implying that investors are losing faith in the BoJ’s ability to control the yield curve indefinitely. This is critical because central bank credibility underpins the low-yield environment that has defined global markets since 2008.

A loss of control in Japan could have a domino effect, as other central banks (e.g., the Federal Reserve, European Central Bank) rely on similar tools to manage yields. If markets begin to doubt central bank dominance, global bond yields could rise, increasing borrowing costs for governments and corporations.


Global Ripple Effects


Based on three historical parallels of past bond market disruptions:

  • Japan’s 1998 VaR Shock: A sudden spike in bond yields due to market volatility.
  • 1994 U.S. Bond Market Revolt: A rapid rise in U.S. Treasury yields following Federal Reserve rate hikes.
  • 2022 U.K. Gilt Crisis: A sharp sell-off in U.K. bonds triggered by fiscal policy uncertainty.

These events suggest that a loss of central bank control over long-term yields in Japan could trigger a broader repricing of sovereign risk globally, affecting other major bond markets, particularly U.S. Treasuries.

Impact on U.S. Treasuries: Japanese institutions are major holders of U.S. Treasuries. If they sell these assets to rebalance portfolios or support the yen, it could reduce demand for U.S. bonds, pushing U.S. yields higher. This is particularly concerning for the long end of the yield curve (e.g., 30-year Treasuries), where demand is already sensitive to global flows.


Moody's Downgrade Fuels US Default Concerns


The X post by Richard Bernstein Advisors highlights a graph showing the credit default swap (CDS) spreads for US Treasuries compared to AAA-rated sovereign debt from nations like Singapore (9.400 bps), Denmark (4.035 bps), and Sweden (2.820 bps), indicating a significant market concern about US fiscal health as of May 22, 2025.

The CDS spread for the US spiked to 60.150 basis points, far exceeding other AAA-rated countries, reflecting investor fears of potential default risk following Moody’s downgrade of the US credit rating on May 16, 2025, due to ballooning debt and deficits, as reported by Bloomberg.

Federal Reserve Bank of Chicago data on the 2023 debt ceiling episode shows that elevated CDS spreads can stem from low valuations of long-term Treasury securities, a trend likely exacerbated in 2025 by rising yields (10-year Treasury at 4.5%) and fiscal irresponsibility concerns noted by the US GAO.


Conclusion


Investors should monitor the speed of yield changes, Fed policy signals, and equity valuations while preparing for potential volatility. Diversifying into defensive sectors, hedging with safe-haven assets (e.g., gold and Swiss franc), and tracking yield curve dynamics can help mitigate risks. 

Tuesday, May 20, 2025

Market Reality Check: Why a V-Shaped Rebound Is Unlikely, Per @bravosresearch (May 20, 2025)

An X thread shared by @bravosresearch argues that while some investors expect a V-shaped recovery in the stock market similar to previous instances (e.g., 2020 post-COVID crash), the current economic environment lacks the conditions that drove those recoveries, particularly massive liquidity injections. 

Key points include:

  • Absence of Massive Liquidity: Unlike the 2020 recovery, which was fueled by significant central bank interventions and government stimulus, the current market lacks similar support, reducing the likelihood of a sharp, V-shaped rebound.
    • In 2025, no comparable liquidity injections are occurring. The Federal Reserve's rate cuts over the past year seem insufficient to mimic the 2020 stimulus-driven recovery. A US debt downgrade by Moody’s and rising bond yields signal tighter financial conditions, with higher yields increasing borrowing costs and lowering bond prices.
  • Conditions for a V-Shaped Recovery: For a V-shaped recovery to occur, the economic outlook would need a dramatic improvement, with fears from earlier in 2025 (e.g., trade war concerns, market volatility) dissipating quickly. This is seen as a "big ask" but not impossible.
    • The market’s path depends on whether positive developments (e.g., trade deal, continued earnings strength) can outweigh negative pressures. The high consumer inflation expectations (7.3% per the University of Michigan, as noted in Ben Reppond’s broadcast) suggest persistent economic unease, making a rapid shift in outlook difficult.
  • Optimism from US-China Trade Deal: Some investors are hopeful due to a potential US-China trade deal, which could alleviate tariff-related pressures and boost market sentiment.
  • Historical Precedent: The 2020 market crash saw a 35% drop in stocks due to COVID, followed by a rapid recovery to all-time highs, driven by liquidity and policy support. The author uses this as a benchmark for what a V-shaped recovery entails.
  • Corporate Earnings Resilience: Despite a 20% market drop in 2025, S&P 500 earnings estimates are higher than in January, supported by:
    • A weaker US dollar, boosting international revenues for US companies.
    • Lower gas prices, supporting consumer spending.
    • The lagged effect of Federal Reserve rate cuts over the past year, which may now be stimulating economic activity.
  • Tariff Concerns: The author identifies tariffs as a significant risk, overshadowing positive factors and lowering the odds of a V-shaped recovery due to their potential to disrupt supply chains, increase costs, and dampen economic growth.

Conclusion


The X thread argues that a V-shaped recovery in 2025 is unlikely due to the absence of massive liquidity injections, persistent tariff risks, and high market valuations, despite supportive factors like strong corporate earnings, a weaker dollar, lower gas prices, and Fed rate cuts. While a US-China trade deal could spark optimism, the conditions differ significantly from the 2020 recovery, which benefited from unprecedented stimulus. The analysis aligns with cautious perspectives from Grantham, Oakley, and Rogers, who highlight risks from overvaluation, tariffs, and rising yields, suggesting investors should temper expectations for a rapid rebound and prepare for volatility.