
Labor Market: Indicators to Monitor Its Health
As noted in [7], there is a very strong correlation between bank tightening, particularly at the small firm level, and employment. The percent of banks tightening on loans to small businesses leads nonfarm payrolls by about 6 months and suggests unemployment levels will be picking up in the coming months.

In this article, we will discuss different ways of monitoring labor market's health.
Recession was one of the most frequent media topics in the past months, with some sources even choosing "looming" as part of the description.[12-17]
Recession happens typically after a period of:
As everyone knows, BLS report is a big one for stock market movements. A number of BLS programs provide information about joblessness based on two types of survey:

In this article, we will discuss different ways of monitoring labor market's health.
Recession
Recession was one of the most frequent media topics in the past months, with some sources even choosing "looming" as part of the description.[12-17]
Recession happens typically after a period of:
- Over-investment
- Tight labor conditions
- Labor market usually peaks 7 months in advance of a recession
- Tight central bank monetary policies
- Significant capacity constraints[8]
- The Federal Reserve monitors capacity constraints because they indicate where supply bottlenecks are developing and inflation is beginning to simmer
- In the last recession, the National Bureau of Economic Research (NBER) declared that the business cycle peak was December 2007. Yet, The capacity utilization rate began declining long before the recession began.
In this article, we will focus only on labor market or employment.
Bureau of Labor Statistics (BLS)
- Business establishment survey
- Asks businesses how many people worked for them
- Typically, economists trust the establishment survey more because it has a larger sample and is less volatile
- Household survey
- Asks regular folk like you and me if we are working
- But the household survey does have value:
- It covers a wider swathe of the country, because it includes self-employed workers, farm workers, and people working in family businesses
- At times, the household survey picks up labor-market trends that the establishment survey can’t
Although many hours and words are wasted on trying to predict BLS' numbers, it is in fact not predictable. It comes in with a surprise in one direction or the other more often than any other set of numbers.
And as a result it most often creates a one to three-day triple digit move by the Dow in one direction or the other. In addition, whatever is the original direction in reaction to the report is usually reversed over the subsequent few days, and the market returns to whatever was its focus prior to the report.

As Richard Bernstein noted in [9], most of the numbers in the monthly employment report are LEADING or COINCIDENT indicators of the economy. For example, some indicators of employment, like jobless claims and the length of the work week, are actually official leading indicators of the economy. Payroll employment is a coincident indicator. Some economists even argue that:
Employment and Economy
As Richard Bernstein noted in [9], most of the numbers in the monthly employment report are LEADING or COINCIDENT indicators of the economy. For example, some indicators of employment, like jobless claims and the length of the work week, are actually official leading indicators of the economy. Payroll employment is a coincident indicator. Some economists even argue that:
In an environment of deleveraging and deflation, employment trends and monthly labor numbers become leading indicators as opposed to lagging.However, most economists agree on that both unemployment rate and salary/benefit trends are lagging indicators—also a lagging condition in both directions. Stock market (which always looks ahead 6 to 9 months) will have already recovered significantly before the recession bottoms and the economy begins to recover. Like employment, earnings don't stop falling and begin to pick up until well after the economy has bottomed and is growing again (see the chart above).
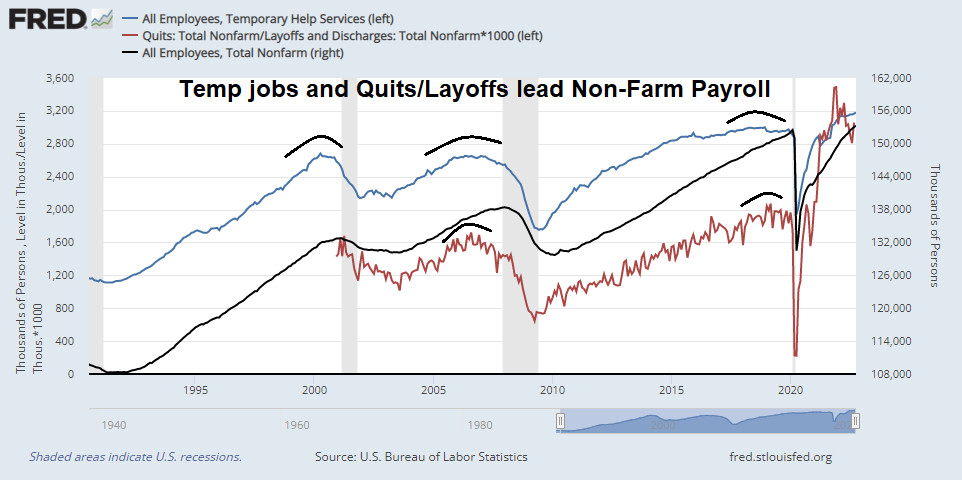 |
| Temp jobs and quits/layoffs (from #JOLTS) lead #NFP Labor. Currently, market is cooling, but not crashing (Oct 2022) |
Labor Statistics
To monitor labor conditions or economy, you should pay attention to the following statistics:
Another way to monitor the health of labor market is following companies whose business is to help people get jobs :
- Employment Cost Index (ECI)
- Labor is 40% of corporate costs according to the BEA
- Janet Yellen’s favorite wage indicator
- Two components of labor costs:
- Wages
- Roughly 70% of ECI
- Benefits
- For example, paid vacation, Social Security, workers’ compensation, and health insurance.
- Roughly 30% of ECI
- Personal Income
- To have organic US domestic economic growth is to have growth in income
- The character of personal income will determine outcomes in housing, auto sales, general consumption, and the pace and level of household deleveraging.
- Components of income
- Wage and salary income
- Accounts for 54% of total US personal income.
- Benefits
- Accounts for 19% of total US personal income
- Driven by government social benefits, which not only includes unemployment benefits, but also SSI payments.
- Small Business' Health
- Insperity (old: Administaff) is an excellent bellwether for how investors feel about the fate of small business
- Small Business Optimism Index (NFIB)
- The report is released on the second Tuesday of each month
- Initial Claims
- During current recovery, stock prices have been highly inversely correlated with initial claims
- Should initial claims start to rise again, it could spell trouble for the economic growth outlook and therefore stock prices.
- However, initial claims was not a good explanatory variable for stock prices during the secular bull market (1985-1999)
- Labor Market Conditions Index (Fed)
- Fed consolidates a number of traditional measures of unemployment to create a cohesive picture of the labor market.
- The Conference Board Employment Trends Index™ (ETI)
- The Index aggregates eight labor-market indicators, which filters out “noise” to show underlying trends more clearly.
- Wage Growth Tracker (Atlanta Fed)
- Is an estimate of the wage growth of continuously employed workers - the same worker's wage is measured in the current month and a year earlier.
- Wage growth (Atlanta's Fed WGT is an example) measures that focus on the continuously full-time employed are likely to do a better job of gauging labor market strength, since they are constructed to more clearly capture the wage dynamics associated with improving labor market conditions.
- JOLTS (Job Openings and Labor Turnover Survey)
- The Bureau of Labor Statistics (BLS) collects and compiles JOLTS data monthly from a sample of nonfarm establishments.
- A more detailed discussion of JOLTS concepts and methodology is available online here
Recruiting Firms
Another way to monitor the health of labor market is following companies whose business is to help people get jobs :
- MAN
- ManpowerGroup Inc. is a Germany-based provider of workforce solutions and services.
- Employment conditions both domestically and in Europe should reflect the macro picture for ManpowerGroup,
- KFY
- Korn/Ferry International provides executive recruitment, leadership development, enterprise learning, succession planning and recruitment process outsourcing, among others.
- Its clients include public and private companies, middle market and emerging growth companies, as well as government and nonprofit organizations.
- KELYA
- Kelly Services
- RHI
- Robert Half International
- ASGN
- On Assignment
- KFRC
- Kforce
- TBI
- True Blue
- PAGE.L
References
- Labor Indicators: Some of Today's Trends Pre-Date the Great Recession
- Chart of the Day: Nonfarm Payrolls and Bank Tightening
- The percent of banks tightening on loans to small businesses leads nonfarm payrolls by about 6 months since, as banks tighten, small businesses have difficulty funding their operations and layoff workers.
- Weighing The Week Ahead: What Are The Biggest Market Worries?
- Why Monster Worldwide Fell 36% Despite Q4 Earnings Beat
- St. Louis Fed
- The Civilian Labor Force, Unemployment Claims and the Business Cycle
- Update: Global Liquidity, LEIs, and Bank Tightening
- Capacity Constraints
- Why Was Weak Employment A Surprise?
- The Mood In Silicon Valley Is Like The "Moment After The Titanic Hit An Iceberg"
- Earnings Update
- If There Is a Recession in 2016, This Is How It Will Happen
- Bear Markets Without Recessions – It’s a thing
- With recession lights amber, brittle markets vulnerable to all shocks
- 22 Signs That The Global Economic Turmoil We Have Seen So Far In 2016 Is Just The Beginning
- Smelling the Recession
- 13 Charts On The Likelihood Of A Recession
- Change in Labor Market Conditions Index
- What Is the Labor Market Conditions Index?
- Secular Trends in Employment: Goods Producing Versus Services Providing (good)
- Payroll Jobs +215,000, Unemployment Rate Ticks Up to 5.0% as More People Enter Labor Force
- Number of Civilians Unemployed for 27 Weeks and Over (St. Louis Fed)
- Graph: Labor Force Flows Employed to Not in Labor Force: 16 Years and Over (St. Louis Fed)
- A Statistic About The U.S. Economy That May Surprise You
- Changes to headline payrolls tend to lag corporate profit changes by a six-month time frame, according to BlackRock research
- Small Business Optimism Index (NFIB)
- Will April Be Another January For Investors?
- Redefining the Labor Market (San Francisco Fed)
- Q:
- Normally economy improves, we would expect to see wages to pick up. Why haven't we seen that?
- A:
- This is a math problem, not a wage problem.
- As economy recovered, lots of low-wage workers re-entered the labor market and, therefore, lowered the average wages
- Earlier, low-wage workers exit the labor market and, artificially, raised the average wages
- Labor force trends (good charts)
- Recession Obsession And Full Portfolio Review
- Fred JOLTS


Comments
Post a Comment